
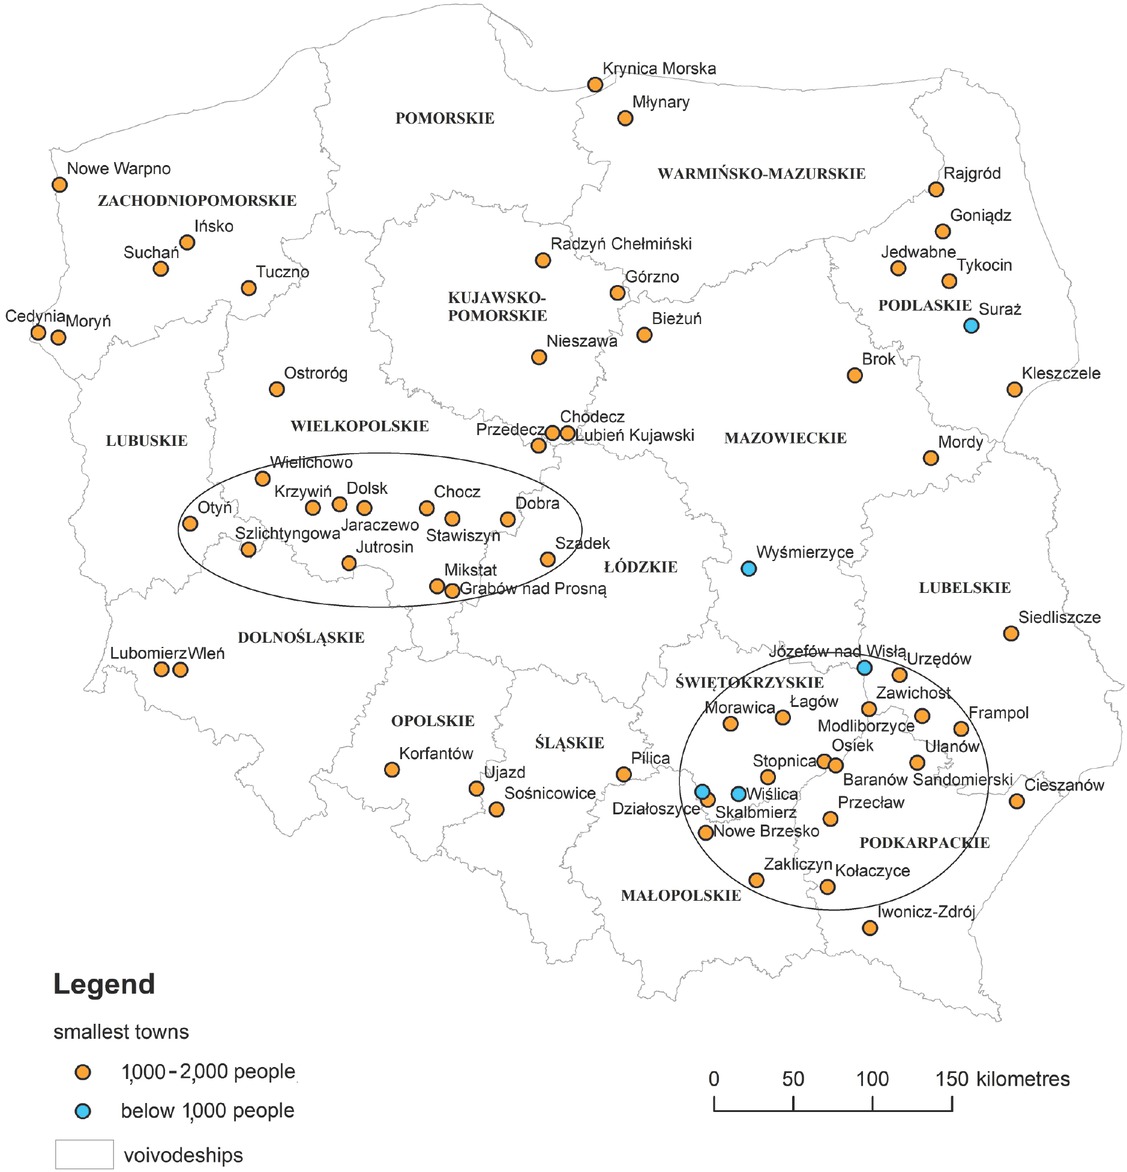
Figure 1
Location and distribution of the smallest towns in Poland (as at 01.01.2018) with the two main clusters marked. Source: own elaboration
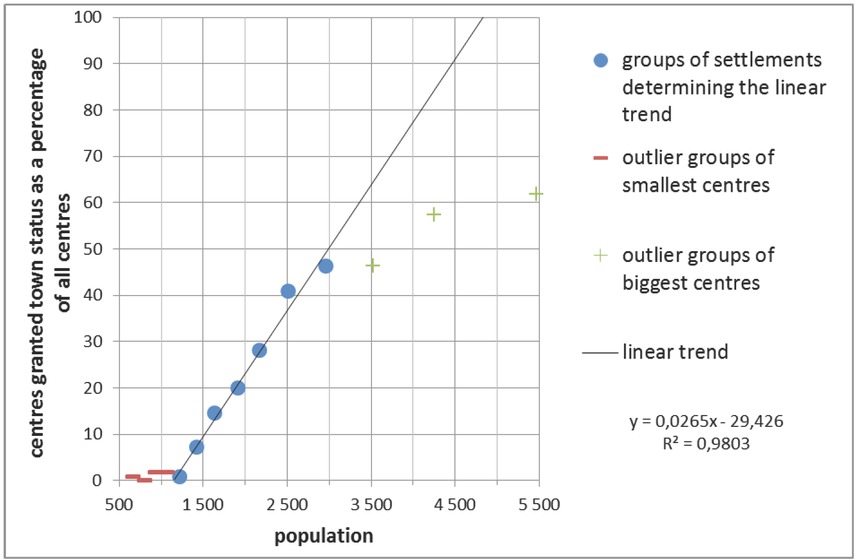
Figure 2
The relationship between population size and the urban status of seats of administrative districts (gmina) in Poland.
Source: own elaboration with the use of Local Data Bank.
Table 1
Types of specialisation in the structure of the economy of the smallest towns in Poland in 2016
| Strong specialisation | Medium specialisation | ||||
|---|---|---|---|---|---|
| Town | Dominant section (PKD 2007) | Florence indicator | Town | Dominant section (PKD 2007) | Florence indicator |
| Bieżuń | A | 29.99 | Górzno | D/A | 9.87/8.24 |
| Radzyń Chełmiński | D/A | 26.36/21.00 | Jutrosin | B | 9.84 |
| Krynica Morska | I/A | 16.92/11.78 | Działoszyce | O | 9.62 |
| Krzywiń | A | 14.02 | Kołaczyce | O | 9.62 |
| Suraż | O | 13.02 | Szadek | D | 9.55 |
| Otyń | A | 12.90 | Bieżuń | E | 9.22 |
| Wiślica | O | 11.83 | Józefów Wisłą nad | O | 9.11 |
| Kleszczele | A/O | 11.29/11.18 | Wielichowo | A | 9.05 |
| Jaraczewo | O | 10.89 | Mordy | A/O | 8.73/7.57 |
| Wyśmierzyce | O | 10.72 | Nowe Warpno | A | 8.60 |
| Goniądz | D | 10.64 | Moryń | A | 8.43 |
| Szlichtyngowa | O | 10.61 | Rajgród | A/O | 7.99/7.91 |
| Cieszanów | E | 10.19 | Ulanów | O | 7.91 |
| Siedliszcze | O | 10.09 | Dobra | O | 7.74 |
[i] where: A – Agriculture, forestry, hunting, fishing; B – Mining, quarrying; D – Electricity, gas, steam, hot water, air conditioning manufacturing and supply; E – Water supply, sewerage, waste management, remediation activities; I – Accommodation, food service activities; O – Public administration, defence, compulsory social security. Source: own study based on Local Data Bank
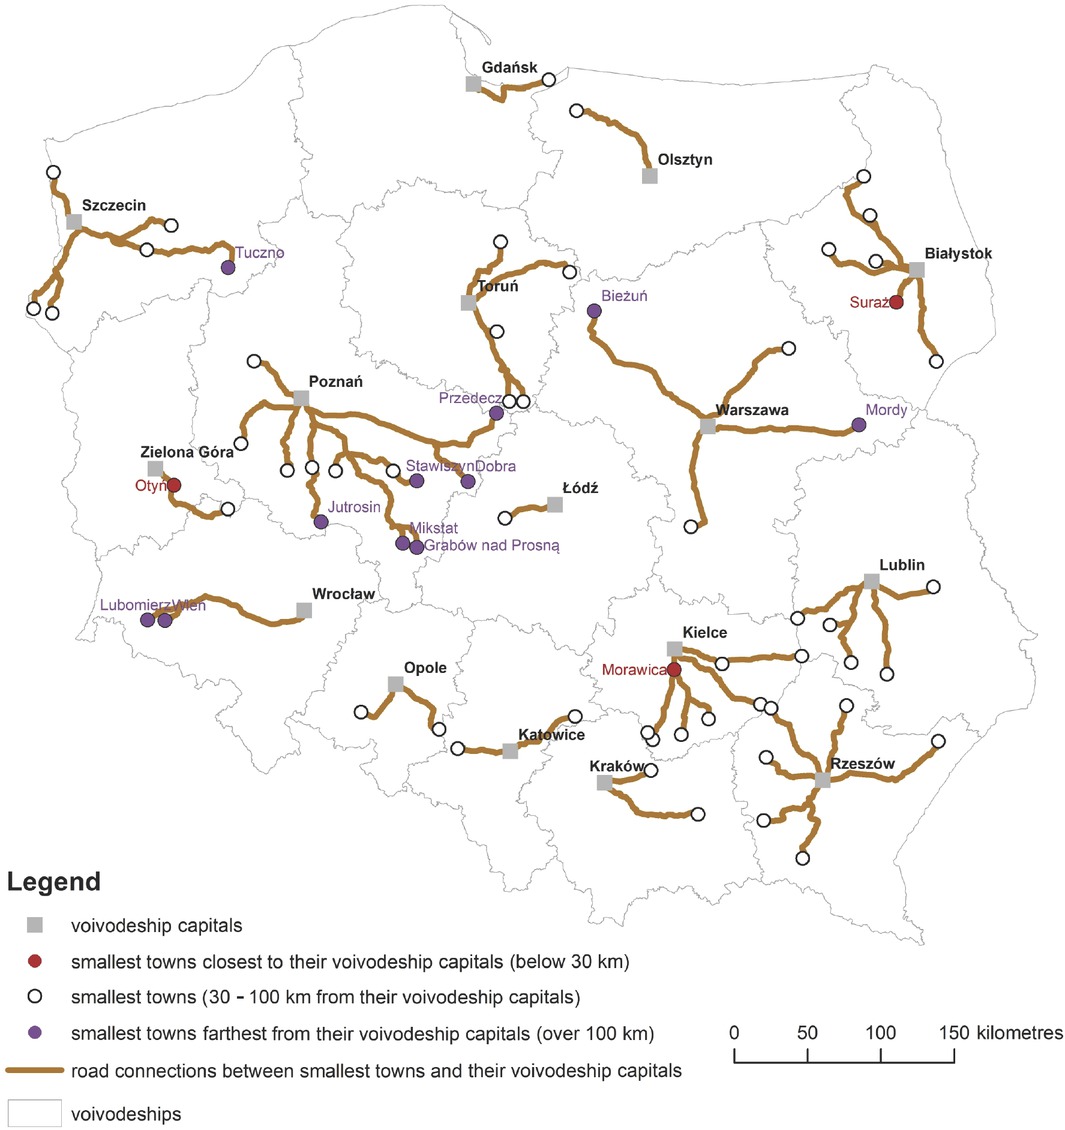
Figure 3
Road connections between smallest towns and their voivodeship capitals in Poland. Source: own elaboration with the use of GIS.