
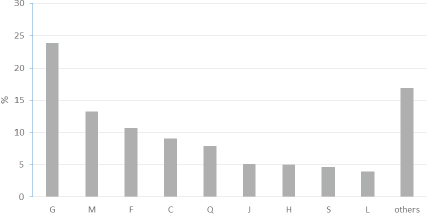
Figure 1
Share of categories listed in the Polish Classification of Business Activity (PKD) in the companies that relocated (%) in 2014. Full names of categories: C – industrial processing; F – construction; G – wholesale and retail trade; repair of vehicles, including motorcycles; H – transport and storage; J – information and communication; L – activity related to providing services on the real estate market; M – professional, scientific and technical activity; Q – healthcare and social work; S – other service activity.
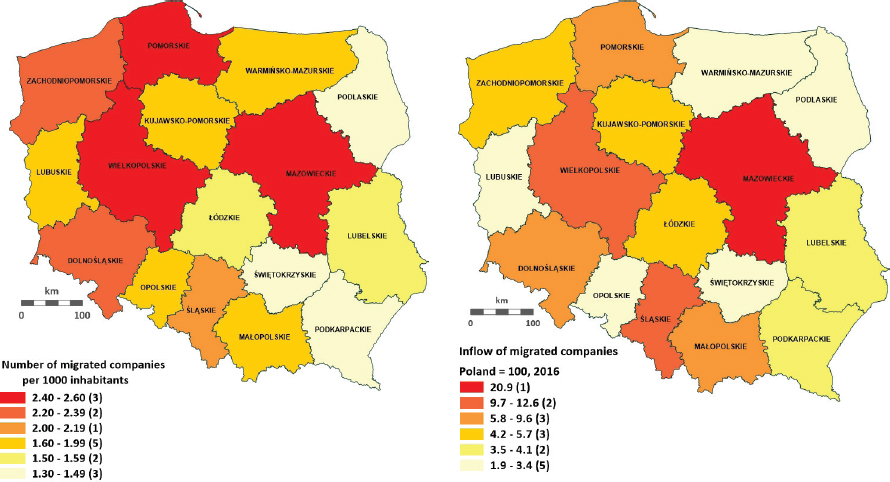
Map 1
Number of migrated companies per 1,000 inhabitants in 2014. Source: own analysis on the basis of the data from GUS (Central Statistical Office)
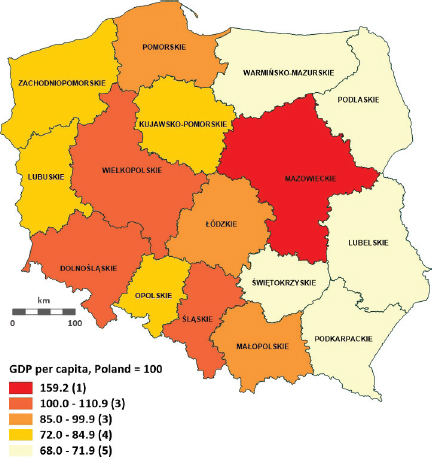
Map 2
Spatial distribution of companies that, following changes in 2014, had moved to a different gmina by 2016 (“inflow” from inside and outside of voivodeship) (Poland=100). Source: own analysis on the basis of data from GUS (Central Statistical Office)
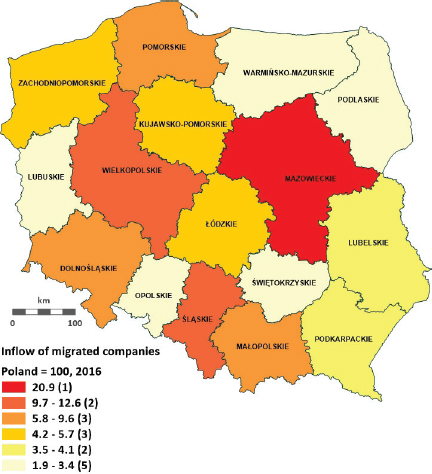
Map 3
GDP per capita in 2016, Poland = 100 (in current prices). Source: own analysis on the basis of data from GUS (Central Statistical Office)
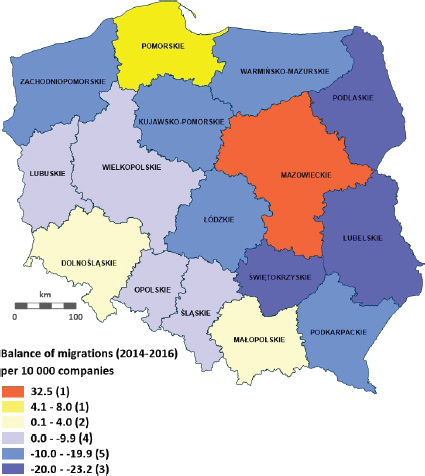
Map 4
External migration balance per 10,000 business entities (2014–2016). Source: own analysis on the basis of data from GUS (Central Statistical Office)
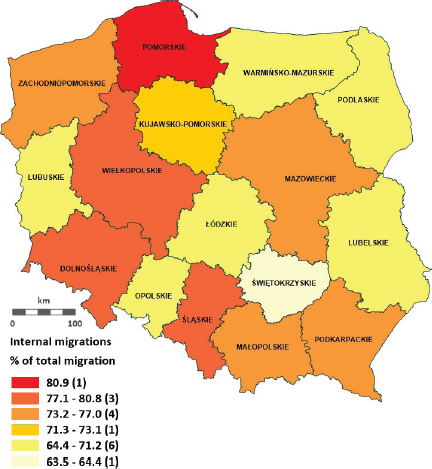
Map 5
% of companies relocating within a voivodeship. Source: own analysis on the basis of data from GUS (Central Statistical Office)
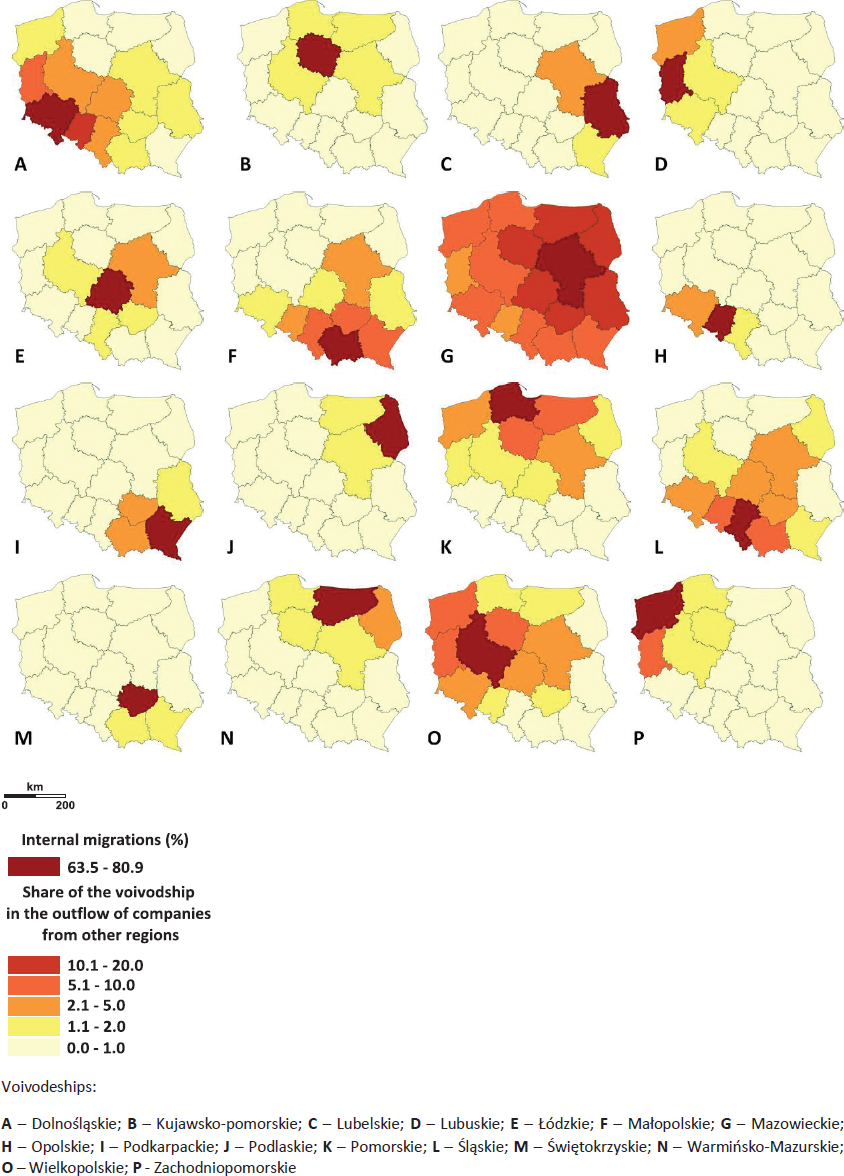
Map 6
Size of internal migration and participation of voivodeships in the outflow of companies from other voivodeships (%). Source: own analysis on the basis of data from GUS (Central Statistical Office)
Table 1
Share of cities in migration of companies to other cities in Poland (relocation of companies in the years 2014–2016)
| Destination in 2016 | |||||||
|---|---|---|---|---|---|---|---|
| Location in 2014 | Warsaw | Gdańsk | Katowice | Kraków | Łódź | Poznań | Wrocław |
| % of total inflow of migrated companies | |||||||
| Warsaw | 8.7 | 9.7 | 9.5 | 14.6 | 8.7 | 8.6 | |
| Gdańsk | 2.1 | 0.7 | 0.3 | 0.6 | 0.5 | 0.7 | |
| Katowice | 1.4 | 0.2 | 2.7 | 1.8 | 0.8 | 0.9 | |
| Kraków | 3.6 | 1.6 | 4.6 | 1.3 | 0.8 | 2.3 | |
| Łódź | 2.6 | 0.4 | 0.9 | 0.6 | 0.7 | 1.2 | |
| Poznań | 4.7 | 1.9 | 2.2 | 2.0 | 2.7 | 3.1 | |
| Wrocław | 3.4 | 1.5 | 1.2 | 1.7 | 1.3 | 1.8 | |
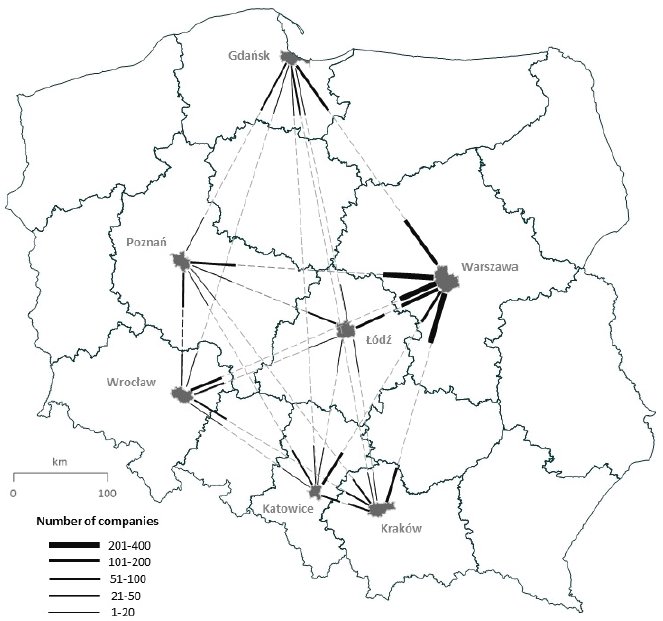
Map 7
Flows of companies between main cities in Poland (the wide lines near each city indicate the inflow of companies to this city from a given other city). Source: own analysis on the basis of data from GUS (Central Statistical Office)
Table 2
Measures of concentration of phenomena
| Coefficient of variation | Max / Min | Average | ||||
|---|---|---|---|---|---|---|
| 2014 | 2016 | 2014 | 2016 | 2014 | 2016 | |
| Companies changing location in 2014 and their target location in 2016 | 69.90 | 80.98 | 8.37 | 11.16 | 4,657.00 | 4,657.00 |
| Newly registered companies | 66.43 | 71.43 | 9.36 | 10.84 | 22,331.19 | 21,830.69 |
| Deregistered companies | 60.43 | 60.54 | 7.30 | 7.49 | 19,041.50 | 18,371.81 |
| Companies with foreign capital | 147.74 | 146.34 | 56.71 | 56.67 | 1,654.00 | 1,622.56 |
| Population size | 52.58 | 52.87 | 5.33 | 5.40 | 2,404,912.63 | 2,402,206.20 |
| Size of workforce according to actual place of performing work | 62.49 | 63.79 | 7.39 | 7.69 | 889,840.75 | 935,275.69 |
| Size of workforce according to location of seat | 84.80 | 85.78 | 11.42 | 11.75 | 646,237.44 | 682,546.25 |