Figure 1
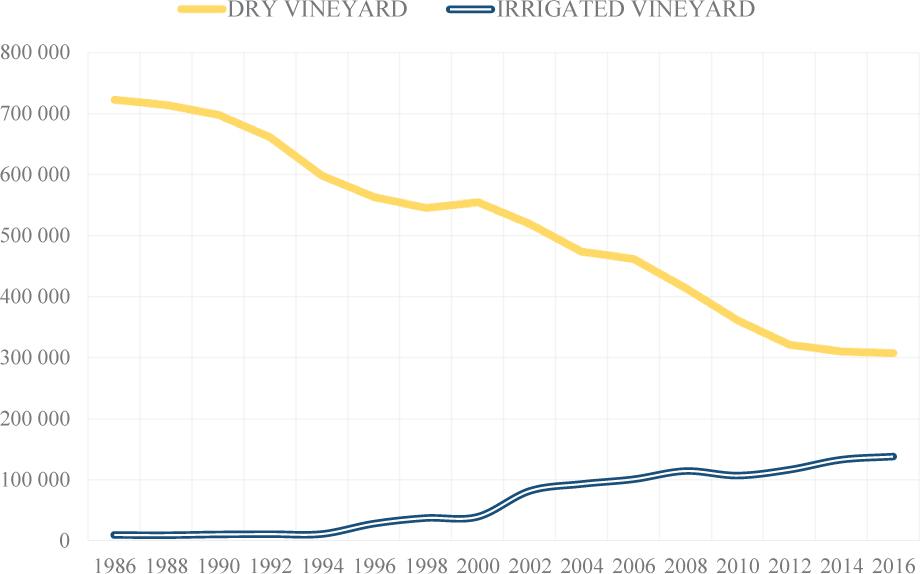
Figure 2
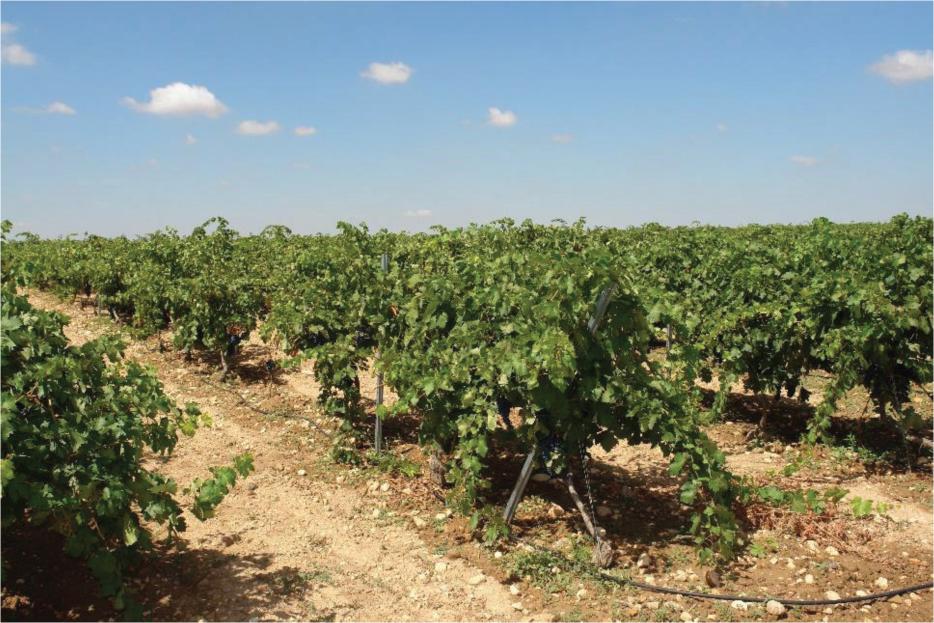
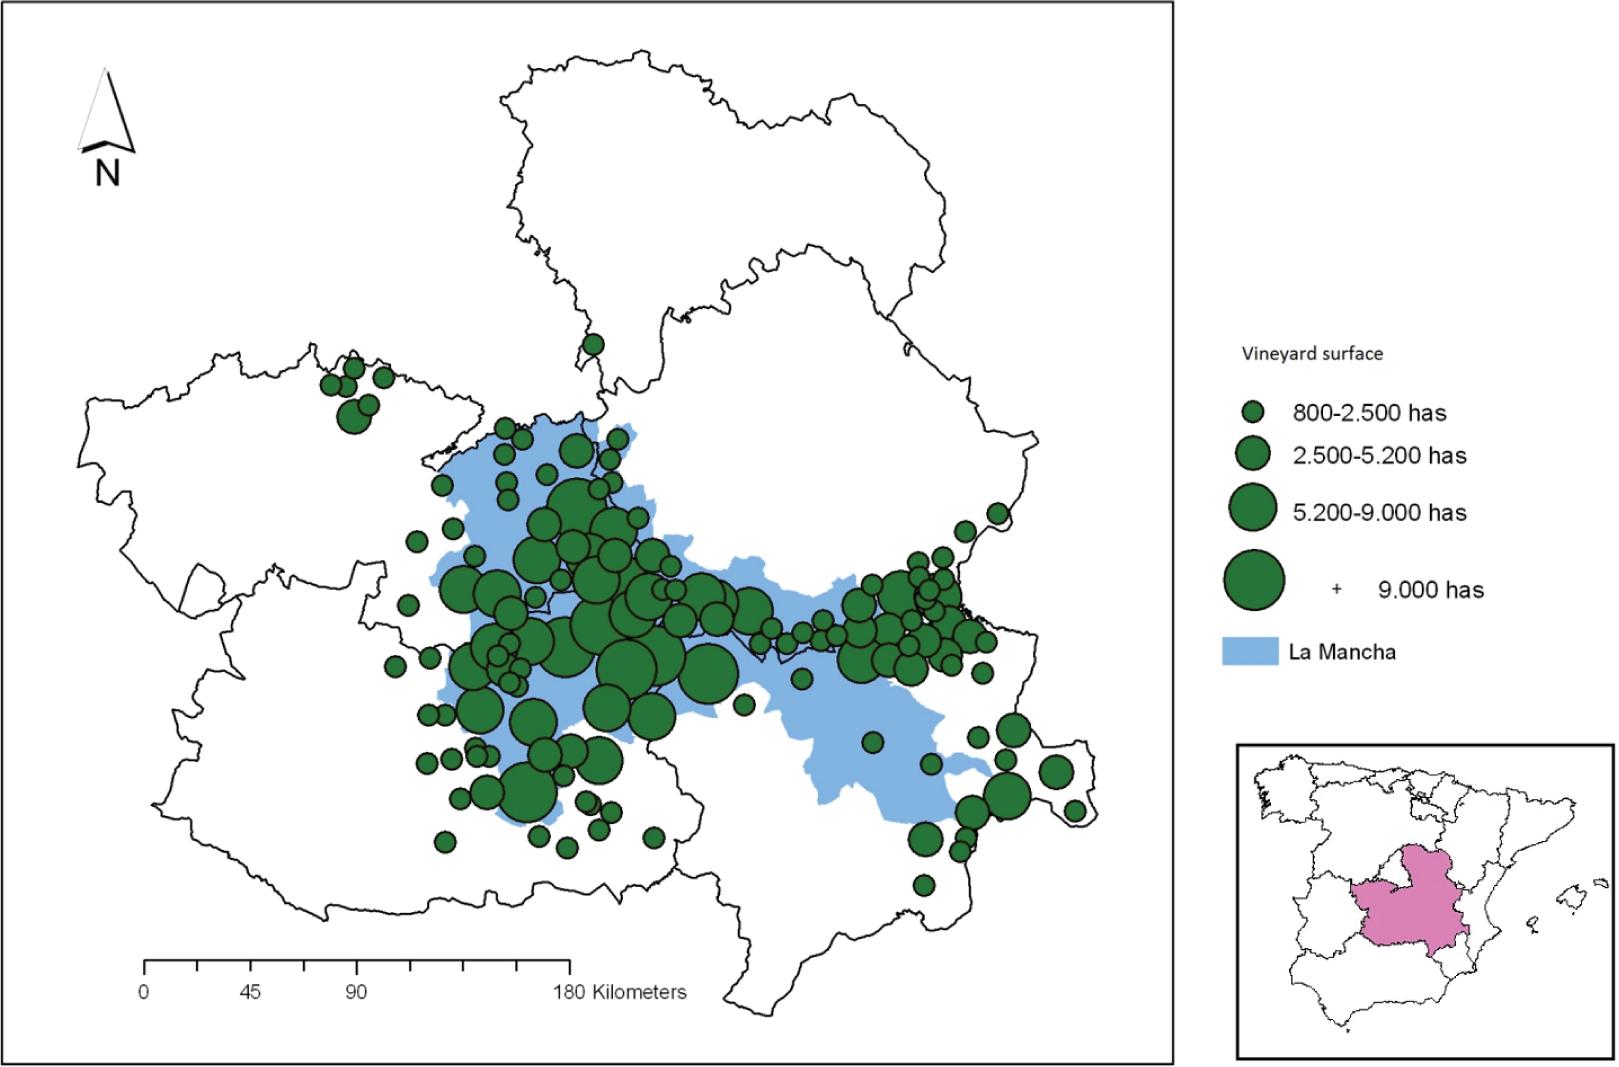
Figure 3
Vineyard surface evolution (hectares) in Castilla-La Mancha (1857–1987)
| 18571 | 18841 | 19041 | 19312 | 19502 | 19722 | 19872 | Balance (1857–1987) (%) |
|---|---|---|---|---|---|---|---|
| 142,367 | 186,000 | 305,634 | 400,901 | 481,187 | 599,881 | 717,295 | +404% |

| 18571 | 18841 | 19041 | 19312 | 19502 | 19722 | 19872 | Balance (1857–1987) (%) |
|---|---|---|---|---|---|---|---|
| 142,367 | 186,000 | 305,634 | 400,901 | 481,187 | 599,881 | 717,295 | +404% |
© 2018 M. Carmen Cañizares, Ángel Raúl Ruiz Pulpón, published by Faculty of Geography and Regional Studies, University of Warsaw
This work is licensed under the Creative Commons Attribution-NonCommercial-NoDerivatives 3.0 License.