
Figure 1
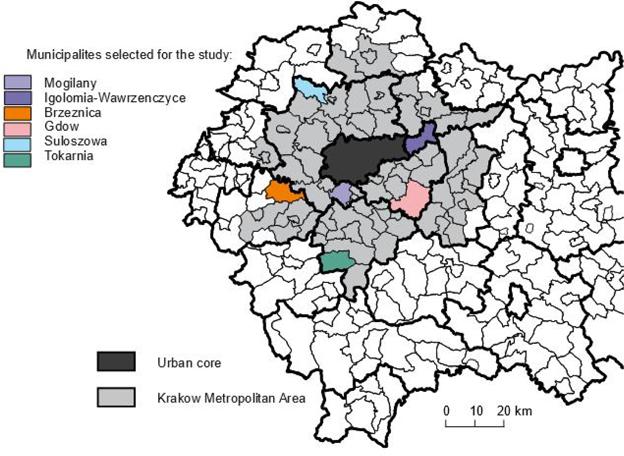
Figure 2
Figure 3
Figure 4
Figure 5
Figure 6
Figure 7
Figure 8
Figure 9
Figure 10
Figure 11
Share of households earning income from agricultural activities, mean urban to rural areas net migration rate for the years 2002–2012, share of respondents working in agriculture
| Municipality | Share of-households earning income from agricultural activities in 2010 [%] Central Statistical Office | Urban to rural areas mean net migration rate / 1,000 inhabitants for the years 2002–2012 Central Statistical Office | Respondents working in agriculture / working respondents own research |
|---|---|---|---|
| Igolomia-Wawrzenczyce | 91.7 | 0.86 | 45.22 |
| Mogilany | 61.1 | 14.64 | 6.67 |
| Brzeznica | 83.8 | 2.82 | 7.61 |
| Gdow | 83.1 | 4.39 | 47.37 |
| Suloszowa | 91.3 | -0.04 | 44.53 |
| Tokarnia | 58.6 | 0.56 | 20.41 |