
Table 1.
Summary of Korean native cattle examined between March and August 2022
| Month | Male | Female | Average age in months | Male calves aged <12 | Female calves aged <12 | Young females 12–25 | Young males 12–25 | Adult females aged >25 | Adult males aged >25 | Total |
|---|---|---|---|---|---|---|---|---|---|---|
| March | 6 | 13 | 34 ± 24 | 2 | 1 | 3 | 3 | 9 | 1 | 19 |
| April | 6 | 12 | 31 ± 17 | 2 | 1 | 3 | 2 | 8 | 2 | 18 |
| May | 5 | 12 | 32 ± 18 | 1* | 1* | 2 | 2 | 9 | 2 | 17 |
| June | 5 | 13 | 32 ± 19 | 1 | 2** | 1 | 2 | 10 | 2 | 18 |
| July | 4 | 13 | 33 ± 19 | 1 | 2 | 1 | 2 | 10 | 1 | 17 |
| August | 3 | 9 | 35 ± 21 | 0*** | 2 | 0 | 2 | 7† | 1 | 12 |
| Total individual animals | 7 | 15†† | - | 3 | 3 | 3†† | 3†† | 11†† | 2†† | - |
| Total observations | 29 | 72 | - | 7 | 9 | 10 | 13 | 53 | 9 | - |
Table 2.
Measured climate parameters in Chuncheon, South Korea where Korean native cattle earwax was sampled from March to August 2022
| Month | Avg temp (°C) | Min temp (°C) | Max temp (°C) | Min humidity (RH%) | Avg humidity (RH%) | Avg THI | Max THI |
|---|---|---|---|---|---|---|---|
| March | 5.7 ± 3.0 | −0.9 ± 4.4 | 12.5 ± 3.5 | 36.5 ± 19.5 | 66.4 ± 14.8 | 45 ± 4* | 56 ± 4 |
| April | 13.0 ± 3.7 | 5.1 ± 4.5 | 21.2 ± 4.5 | 26.0 ± 13.3 | 55.5 ± 11.7 | 56 ± 5* | 65 ± 5 |
| May | 17.2 ± 2.9 | 9.4 ± 3.7 | 25.0 ± 3.3 | 28.6 ± 10.8 | 60.1 ± 7.4 | 62 ± 4* | 70 ± 4 |
| June | 21.9 ± 3.0 | 17.3 ± 4.1 | 27.0 ± 3.6 | 54.8 ± 18.6 | 78.3 ± 13.1 | 70 ± 5** | 75 ± 5 |
| July | 26.0 ± 1.6 | 22.2 ± 1.4 | 31.1 ± 2.9 | 60.1 ± 12.2 | 84.6 ± 5.6 | 77 ± 2** | 81 ± 3 |
| August | 24.5 ± 2.7 | 21.4 ± 3.2 | 28.8 ± 3.4 | 67.1 ± 14.7 | 87.7 ± 8.2 | 74 ± 7** | 79 ± 5 |
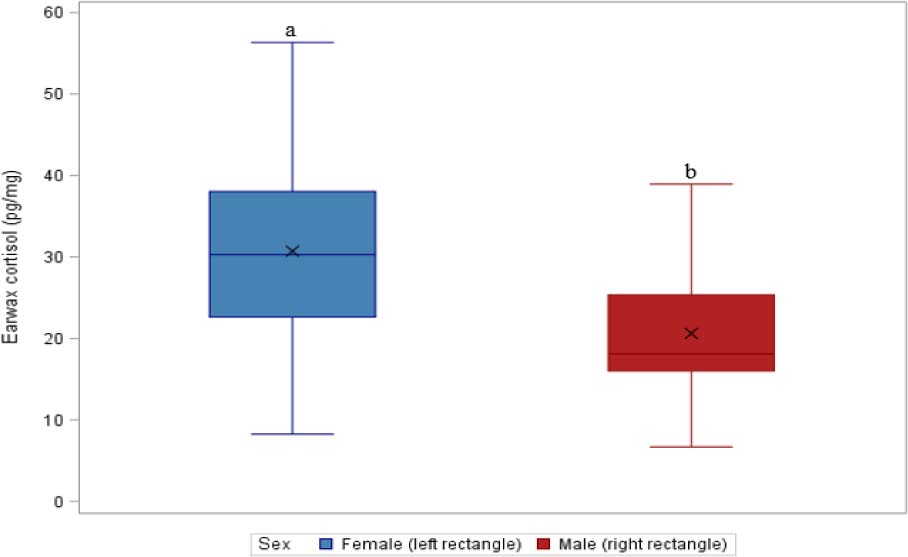
Fig. 1.
Boxplot of earwax cortisol concentration by sex in Hanwoo cattle. The horizontal lines within boxes indicate the median, the “×” marks indicate the mean, and whiskers indicate the minimum and maximum values. Different letters indicate a significant difference between sexes (Tukey–Kramer adjusted P-value < 0.05)
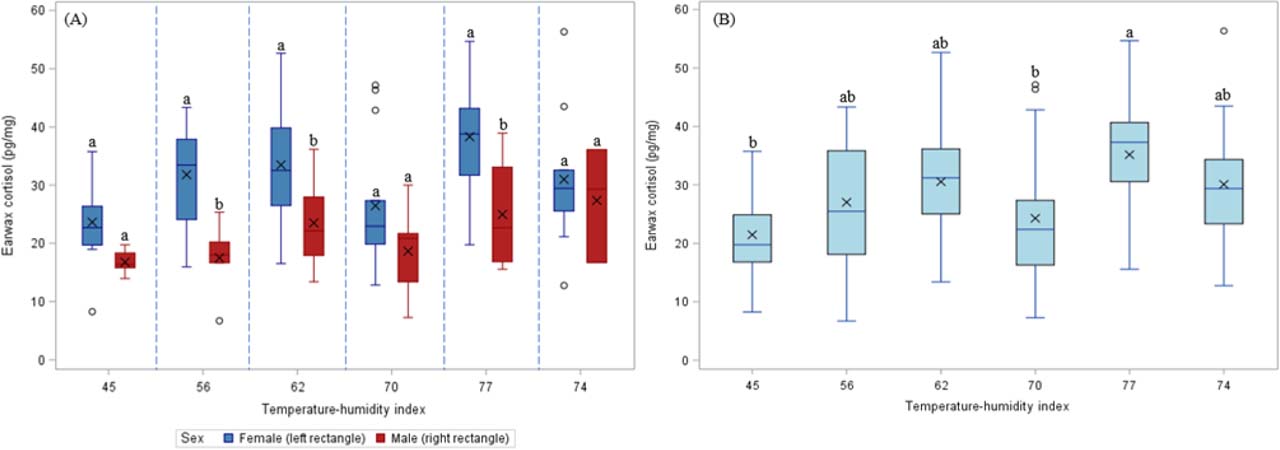
Fig. 2.
Earwax cortisol concentration (ECC) across temperature-humidity index levels corresponding to monthly conditions (March = 45, April = 56, May = 62, June = 70, July = 77 and August = 74). (A) Sex-specific ECC at each THI level. (B) ECC averaged for both sexes. Boxes represent the interquartile range, the horizontal lines within boxes indicates the median, the “×” marks indicate the mean, whiskers indicate the minimum and maximum values, and circles represent outliers. Shared letters indicate no significant difference. Different letters indicate significant differences (Tukey–Kramer adjusted P-value < 0.05)
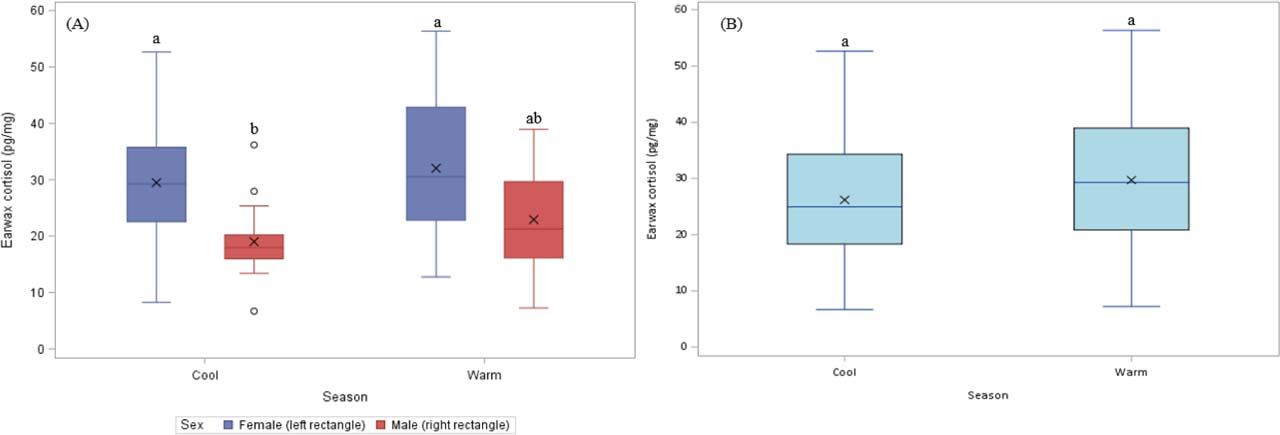
Fig. 3.
Earwax cortisol concentration by sex and season (cool March–May, THI 45–62; warm June–August, THI 70–77). (A) ECC by sex within each season. (B) ECC averaged for both sexes by season. Boxes represent the interquartile range, the horizontal lines within boxes indicate the median, the “×” marks indicate the mean, whiskers indicate the minimum and maximum values, and circles represent outliers. Different letters indicate significant differences (Tukey-Kramer adjusted P-value < 0.05)
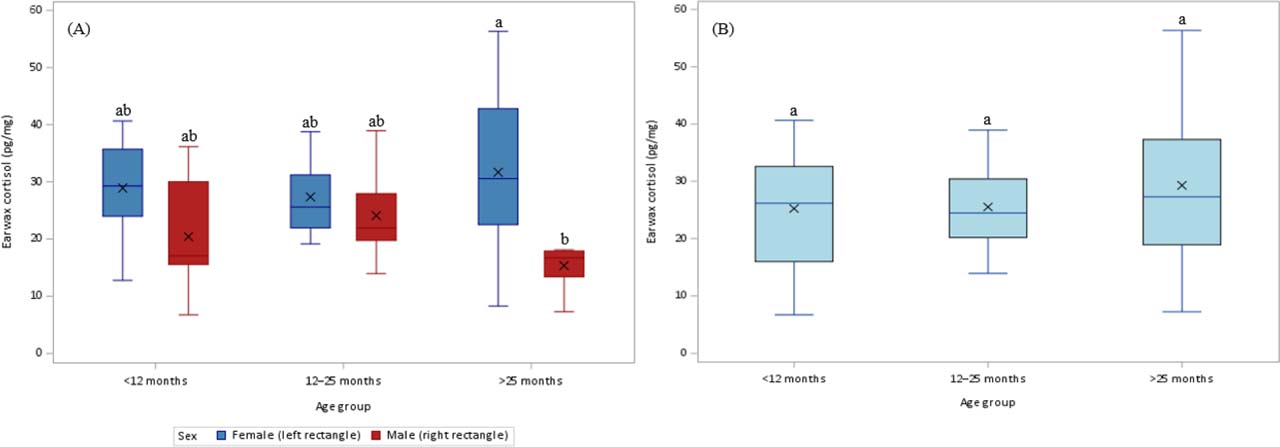
Fig. 4.
Earwax cortisol concentration (ECC) by sex and age group (<12, 12–25 and >25 months), adjusted for temperature-humidity index. (A) Sex-specific ECC by age group. (B) ECC by age group averaged for both sexes. Boxes represent the interquartile range, the horizontal line indicates the median, the “×” marks within boxes indicate the mean, and whiskers indicate the minimum and maximum values. Different letters indicate significant differences (Tukey-Kramer adjusted P-value < 0.05)
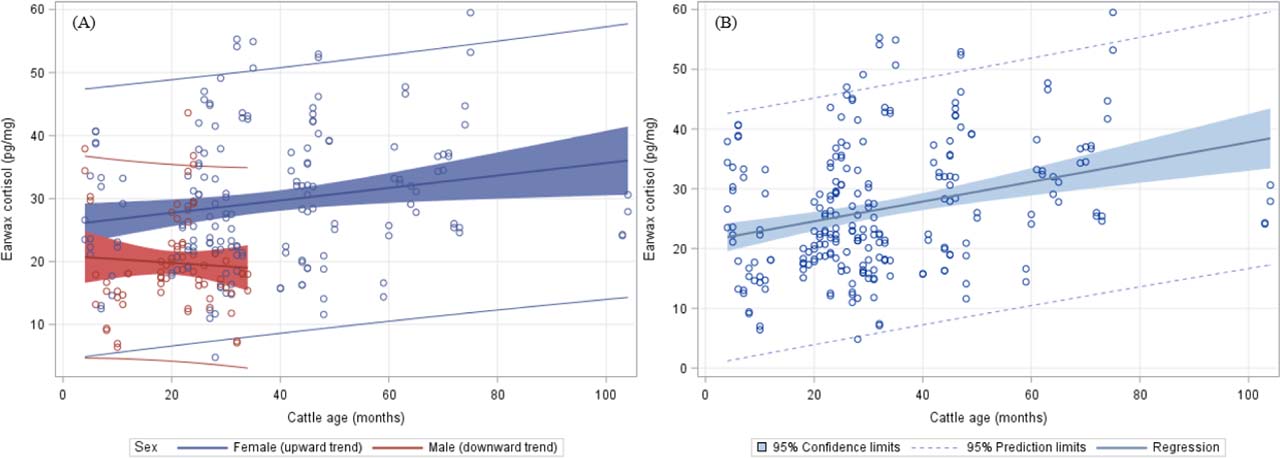
Fig. 5.
Relationship between cattle age and earwax cortisol concentration. (A) Sex-specific linear regressions based on individual ELISA measurements from females (144 measurements from 15 cattle) and males (58 measurements from 7 cattle). (B) Linear regression using the combined dataset (202 ELISA measurements from 101 biological earwax samples collected from 22 cattle). The solid lines represent the fitted regression, the shaded area denotes the 95% confidence interval, and the dashed lines indicate the 95% prediction interval