
Table 1.
Primer sequences used for a qRT-PCR to evaluate TNFα and VEGFA RNA in whole blood from dogs with experimental skin wounds
| Gene symbol | Gene description | Accession number | Primer sequence |
|---|---|---|---|
| TNFα | Tumour necrosis factor | NM_001003244.4 | F: 5′-CTCTCTGCCATCAAGAGCCC-3′ R: 5′-CTAAGCCTGAAGGGGGTGAG-3′ |
| VEGFA | Vascular endothelial growth factor A | NM_001003175.2 | F: 5′-CCCGGTATAAACCCTGGAGC-3′ R: 5′-ACGCGAGTCTGTGTTTTTGC-3′ |
| GAPDH | Glyceraldehyde 3-phosphate dehydrogenase | NM_001003142.2 | F: 5′-CGGGAAACTTGTCATCAACGG-3′ R: 5′-TTTGGCTAGAGGAGCCAAGC-3′ |
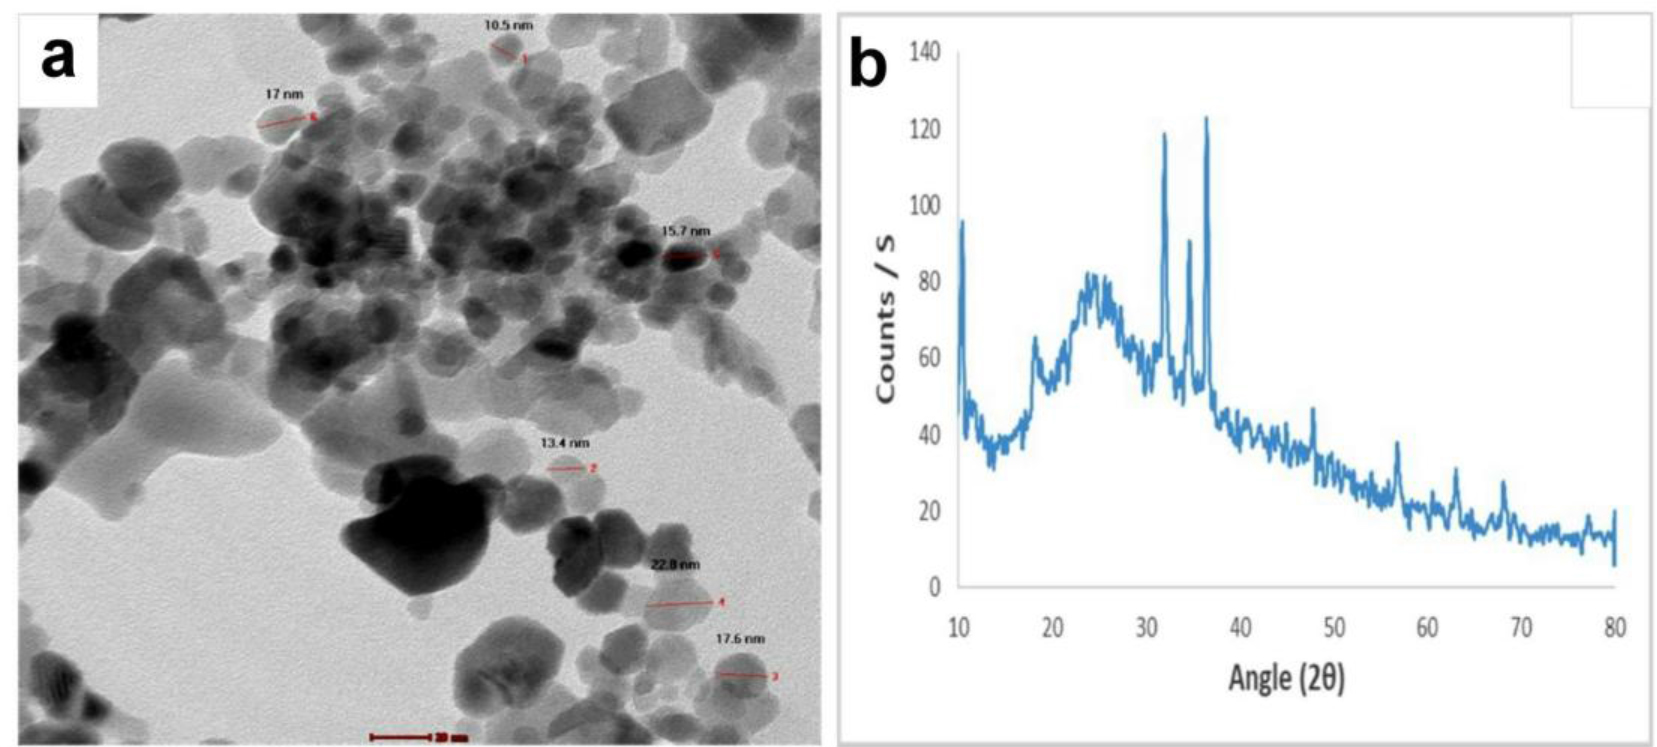
Fig. 1.
Characterisation of chitosan-coated zinc-oxide nanoparticles (CS/ZnO NPs). a – high-resolution transmission electron microscope image showing nearly spherical particles with an average size of 16.2 nm; b – x-ray diffraction pattern analysis indicating the formation of CS/ZnO NPs
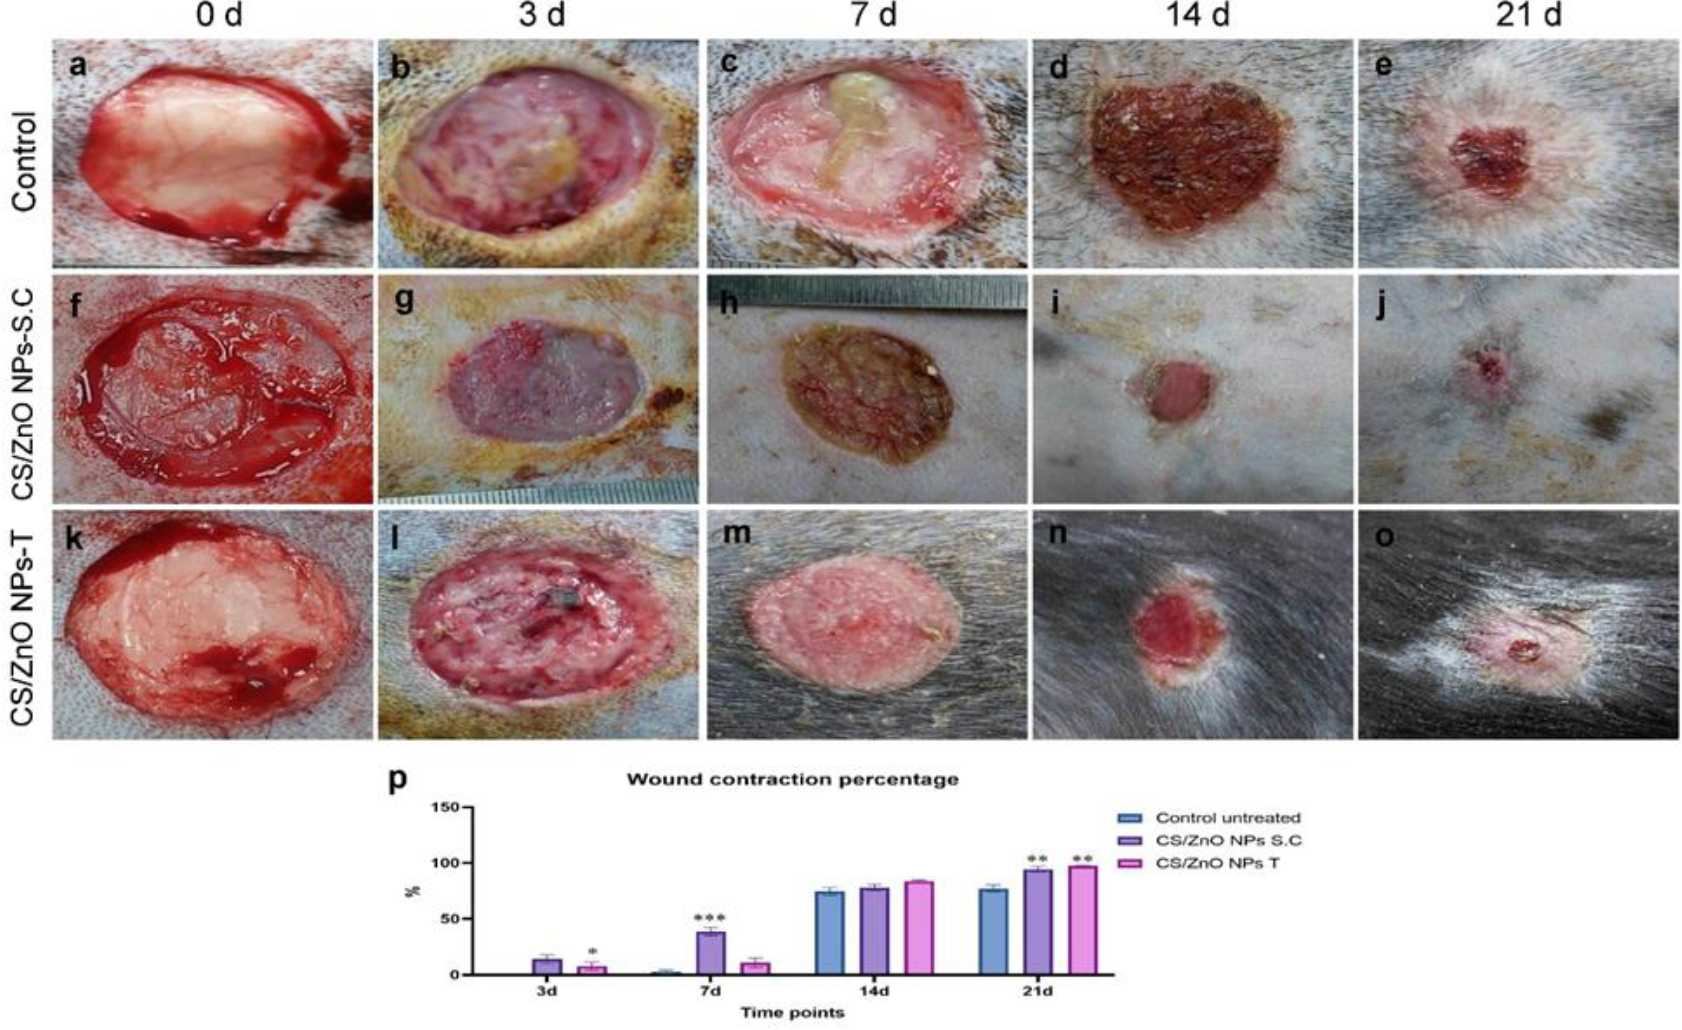
Fig. 2.
Macroscopic observation of a wound in a dog’s skin after applying or not applying chitosan-coated zinc-oxide nanoparticles (CS/ZnO NPs) on day 0 and the 3rd, 7th, 14th and 21st days post treatment (PT). a–e – Control untreated group; f–j – CS/ZnO NP subcutaneously (s/c) injected group treated once weekly at 25 ppm; k–o – CS/ZnO NPs topically (T) applied group treated daily at 25 ppm; p – Bar chart representing wound contraction percentages in the treatment groups on the 3rd, 7th, 14th and 21st days PT. */**/*** – significant difference between groups at the same time-point at P ≤ 0.05/≤ 0.01/≤ 0.001. Values are expressed as means ± SEM
Table 2.
Effect on canine haematological parameters on days 0 and 21 of chitosan-coated zinc-oxide nanoparticle (CS/ZnO NP) subcutaneous injection and topical application used in dog skin wound healing
| Parameter | Untreated | CS/ZnO NP s/c | CS/ZnO NP T |
|---|---|---|---|
| Day 0 HGB (g/dL) | 13.33 ± 0.37 A | 12.83 ± 0.24 A | 12.63 ± 0.19 A |
| Day 0 HCT % | 35.67 ± 0.58 A | 36.00 ± 0.76 A | 35.27 ± 0.91 A |
| Day 0 RBC (×106cell/µL) | 5.83 ± 0.19 A | 5.90 ± 0.13 A | 5.53 ± 0.28 A |
| Day 0 MCV (f/L) | 61.36 ± 2.36 A | 62.00 ± 2.50 A | 63.73 ± 1.63 A |
| Day 0 MCHC (%) | 37.38 ± 0.87 A | 35.65 ± 0.44 A | 35.87 ± 1.18 A |
| Day 0 WBC (×103cell/µL) | 11.66 ± 0.73 A | 11.80 ± 1.01 A | 12.23 ± 0.85 A |
| Day 0 PLT (×103cell/µL) | 276.33 ± 14.49 A | 238.3 ± 16.017 A | 262.22 ± 17.43 A |
| Day 21 HGB (g/dL) | 7.15 ± 0.45 B | 10.83 ± 0.56 B, *** | 11.68 ± 0.47 A, *** |
| Day 21 HCT (%) | 23.17 ± 1.14 B | 29.56 ± 1.31 B, ** | 31.36 ± 1.73 A, ** |
| Day 21 RBC (×106cell/µL) | 4.14 ± 0.15 B | 5.12 ± 0.11 B, * | 5.03 ± 0.10 A, * |
| Day 21 MCV (f/L) | 55.86 ± 1.00 A | 58.02 ± 3.17 A | 62.40 ± 3.73 A |
| Day 21 MCHC (%) | 30.82 ± 0.48 B | 36.61 ± 0.28 A, *** | 37.30 ± 0.61 A, *** |
| Day 21 WBC (×103 cell/µL) | 31.47 ± 2.20 B | 25.82 ± 1.97 B | 16.57 ± 1.68 A, **, # |
| Day 21 PLT (×103cell/µL) | 320.0 ± 11.54 B | 384 ± 10.21 B, * | 390 ± 12.58 B, * |
Table 3.
Effect on canine blood biochemical parameters on days 0 and 21 of chitosan-coated zinc-oxide nanoparticle (CS/ZnO NP) subcutaneous injection and topical application used in dog skin wound healing
| Parameter | Untreated | CS/ZnO NP s/c | CS/ZnO NP T |
|---|---|---|---|
| Day 0 AST (U/L) | 34.00 ± 3.05 | 35.33 ± 2.00 A | 37.68 ± 2.85 |
| Day 0 ALT(U/L) | 45.68 ± 4.63 | 44.00 ± 4.14 | 42.7 ± 4.26 |
| Day 0 total proteins (g/dL) | 6.34 ± 0.05 | 6.22 ± 0.10 | 6.03 ± 0.04 |
| Day 0 ALB (g/dL) | 2.08 ± 0.09 | 2.01 ± 0.08 | 2.03 ± 0.10 |
| Day 0 urea (mg/dL) | 11.41 ± 0.98 | 11.57 ± 0.69 | 12.22 ± 1.00 |
| Day 0 CR (mg/dL) | 0.96 ± 0.08 | 0.95 ± 0.04 | 1.01 ± 0.02 |
| Day 21 AST (U/L) | 36.67 ± 2.60 | 39.33 ± 2.33 B | 38.68 ± 2.40 |
| Day 21 ALT(U/L) | 46.33 ± 3.48 | 45.67 ± 4.05 | 45.00 ± 4.04 |
| Day 21 total proteins (g/dL) | 5.61 ± 0.33 | 6.04 ± 0.22 | 5.98 ± 0.21 |
| Day 21 ALB (g/dL) | 2.12 ± 0.07 | 2.04 ± 0.05 | 2.11 ± 0.17 |
| Day 21 urea (mg/dL) | 11.30 ± 0.79 | 11.56 ± 0.37 | 12.36 ± 0.80 |
| Day 21 CR (mg/dL) | 1.01 ± 0.07 | 1.09 ± 0.06 | 0.99 ± 0.47 |
Table 4.
Effect on some oxidative stress parameters in dogs on days 0 and 21 of chitosan-coated zinc-oxide nanoparticle (CS/ZnO NP) subcutaneous injection and topical application used in dog skin wound healing
| Parameters | Untreated | CS/ZnO NP s/c | CS/ZnO NP T |
|---|---|---|---|
| Day 0 MDA (nmol/mL) | 30.26 ± 2.36 A | 33.90 ± 3.11 A | 31.23 ± 3.15 A |
| Day 0 CAT (U/L) | 197.89 ± 15.72 A | 196.30 ± 15.68 A | 189.97 ± 14.76 A |
| Day 0 TAC (mmol/L) | 1.96 ± 0.04 A | 1.95 ± 0.04 A | 1.89 ± 0.06 A |
| Day 21 MDA (nmol/mL) | 55.77 ± 2.75 B | 34.23 ± 2.15 A, ** | 27.66 ± 2.33 A, *** |
| Day 21 CAT (U/L) | 167.96 ± 11.59 B | 251.67 ± 15.71 B, ** | 268.41 ± 17.31 B, ** |
| Day 21 TAC (mmol/L) | 0.77 ± 0.06 B | 1.55 ± 0.12 B, ** | 1.70 ± 0.90 A, *** |
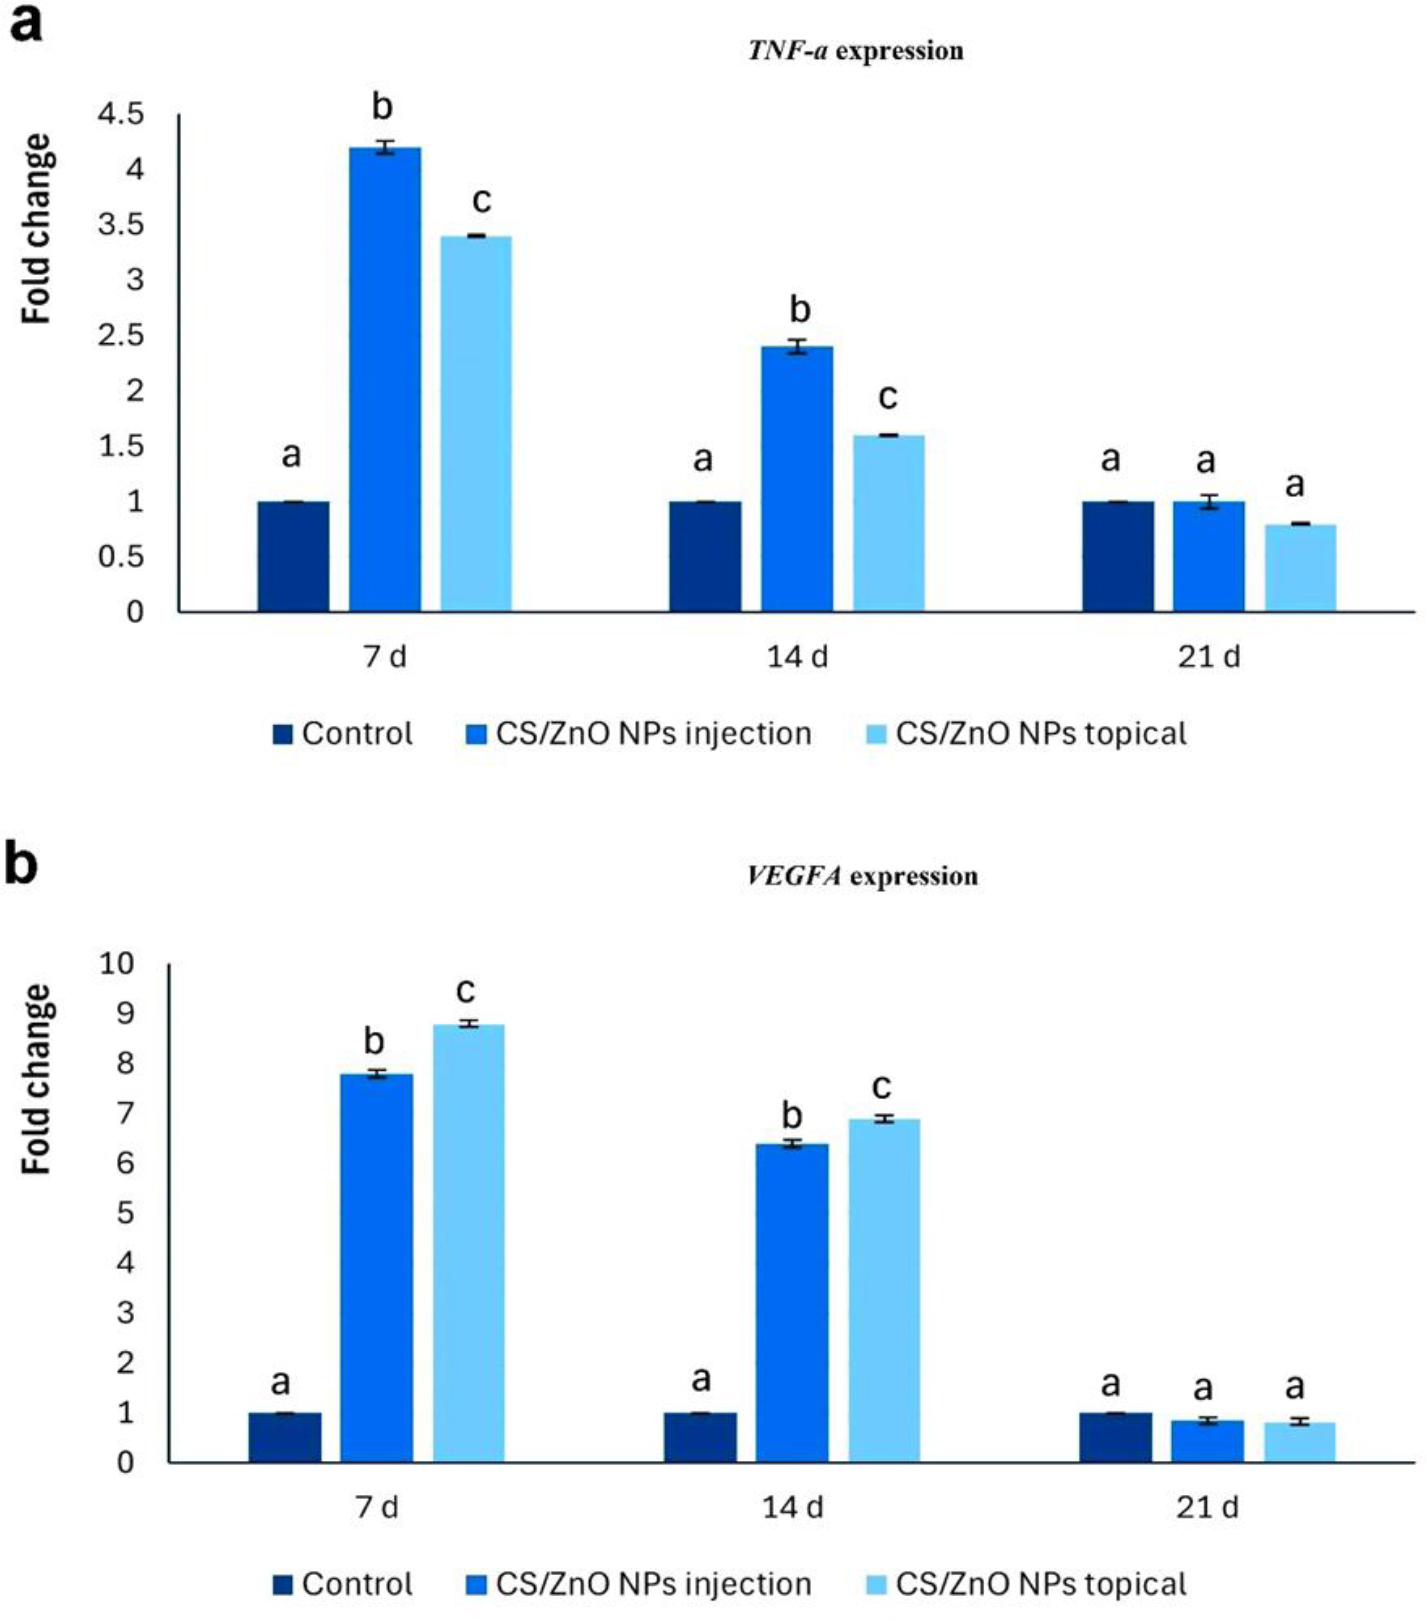
Fig. 3.
Transcript levels of a – TNFα and b – VEGFA genes on the 7th, 14th and 21st days after induction of a wound in dog skin and applying or not applying treatment. injection – administration of chitosan-coated zinc-oxide nanoparticles (CS/ZnO NPs) at 25 ppm once a week for two weeks by subcutaneous injection; topical – administration of chitosan-coated zinc-oxide nanoparticles at 25 ppm daily for two weeks topically; a, b and c – different superscript letters above columns indicate significant difference between groups at the same time point (P-value ≤ 0.05). Values are expressed as mean ± SEM
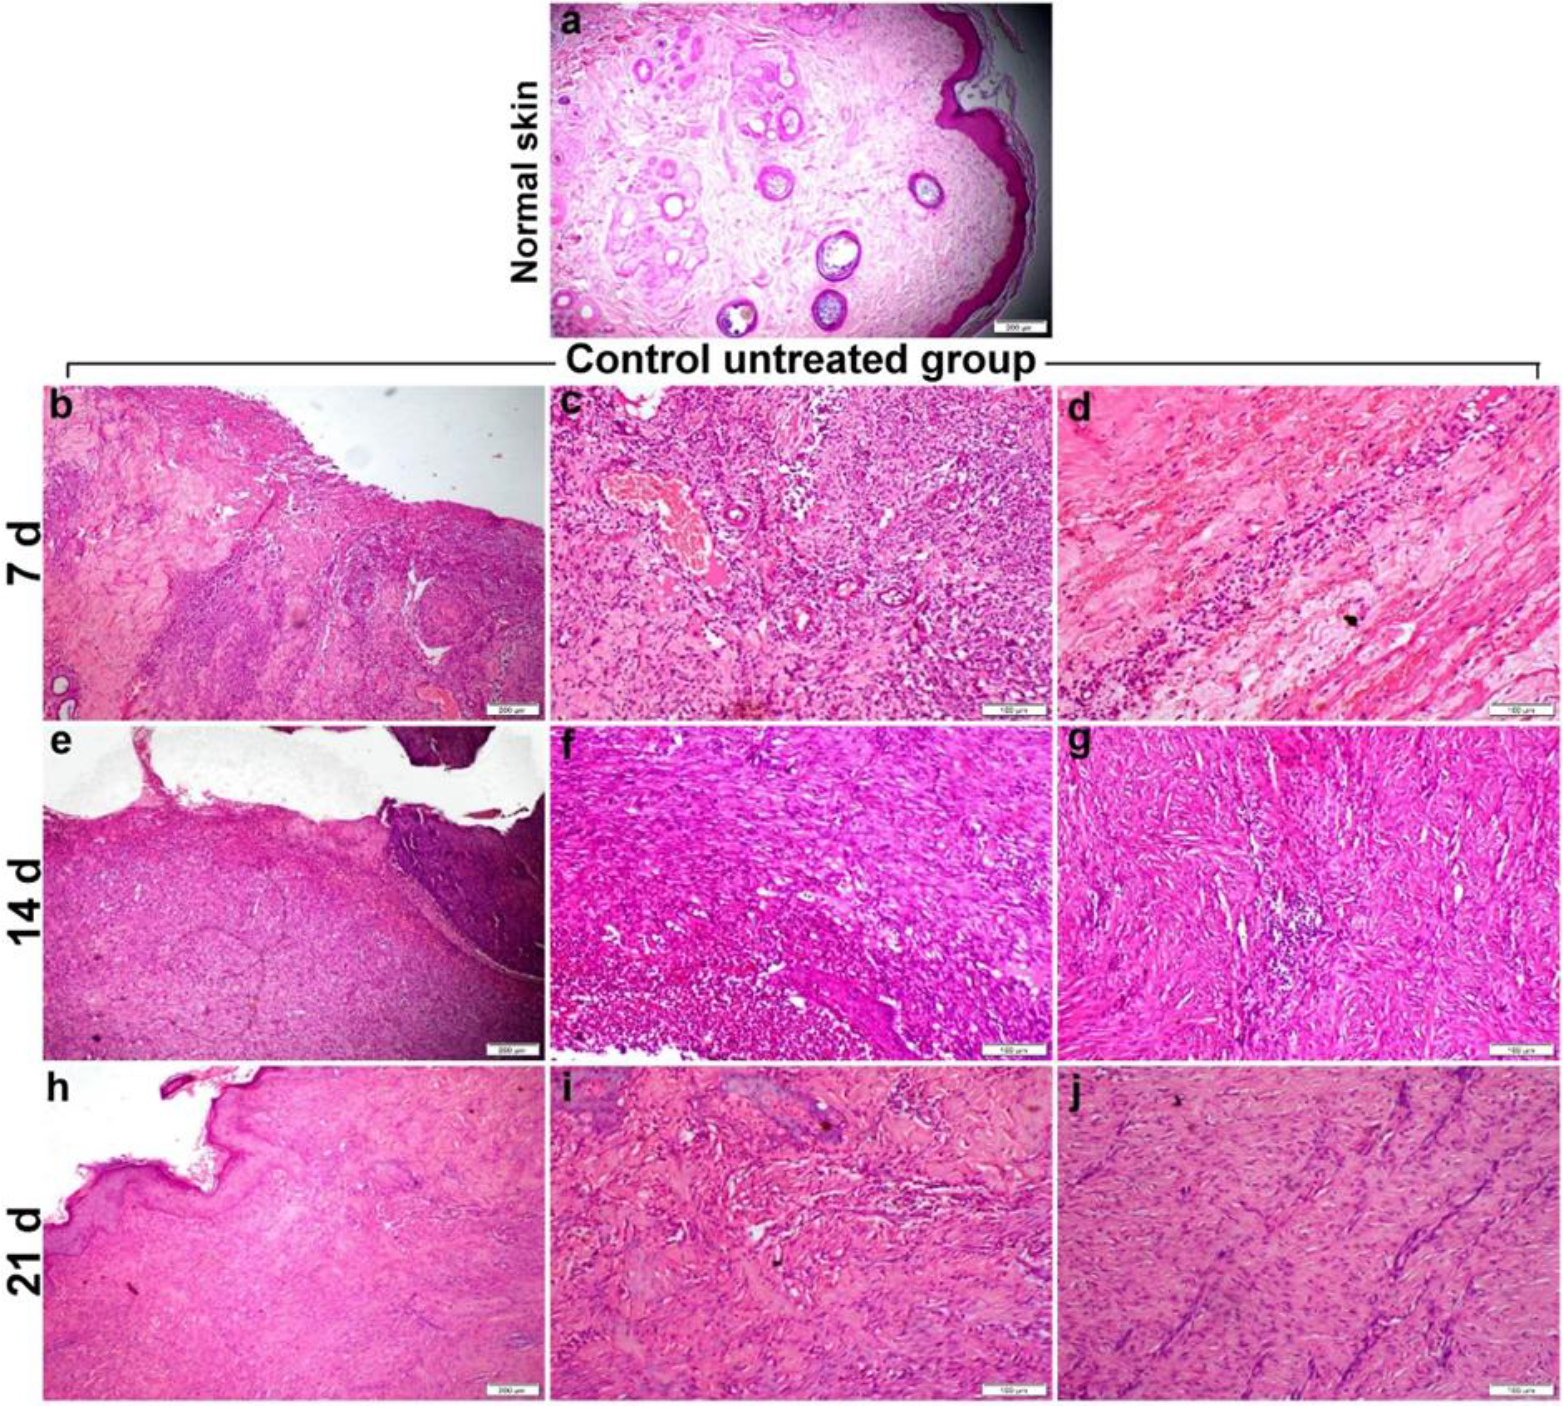
Fig. 4.
Photomicrographs of HE-stained dog skin wound sections obtained from the control untreated group. a – normal histology of intact skin; b–d – wound area on the 7th day post treatment (PT) showing severe inflammation, necrosis, congestion and haemorrhage; e–g – wound area on the 14th day PT showing delayed regeneration, angiogenesis and granulation tissue formation; h–j – wound area on the 21st day PT showing complete re-epithelialisation, thick granulation tissue and collagen deposition
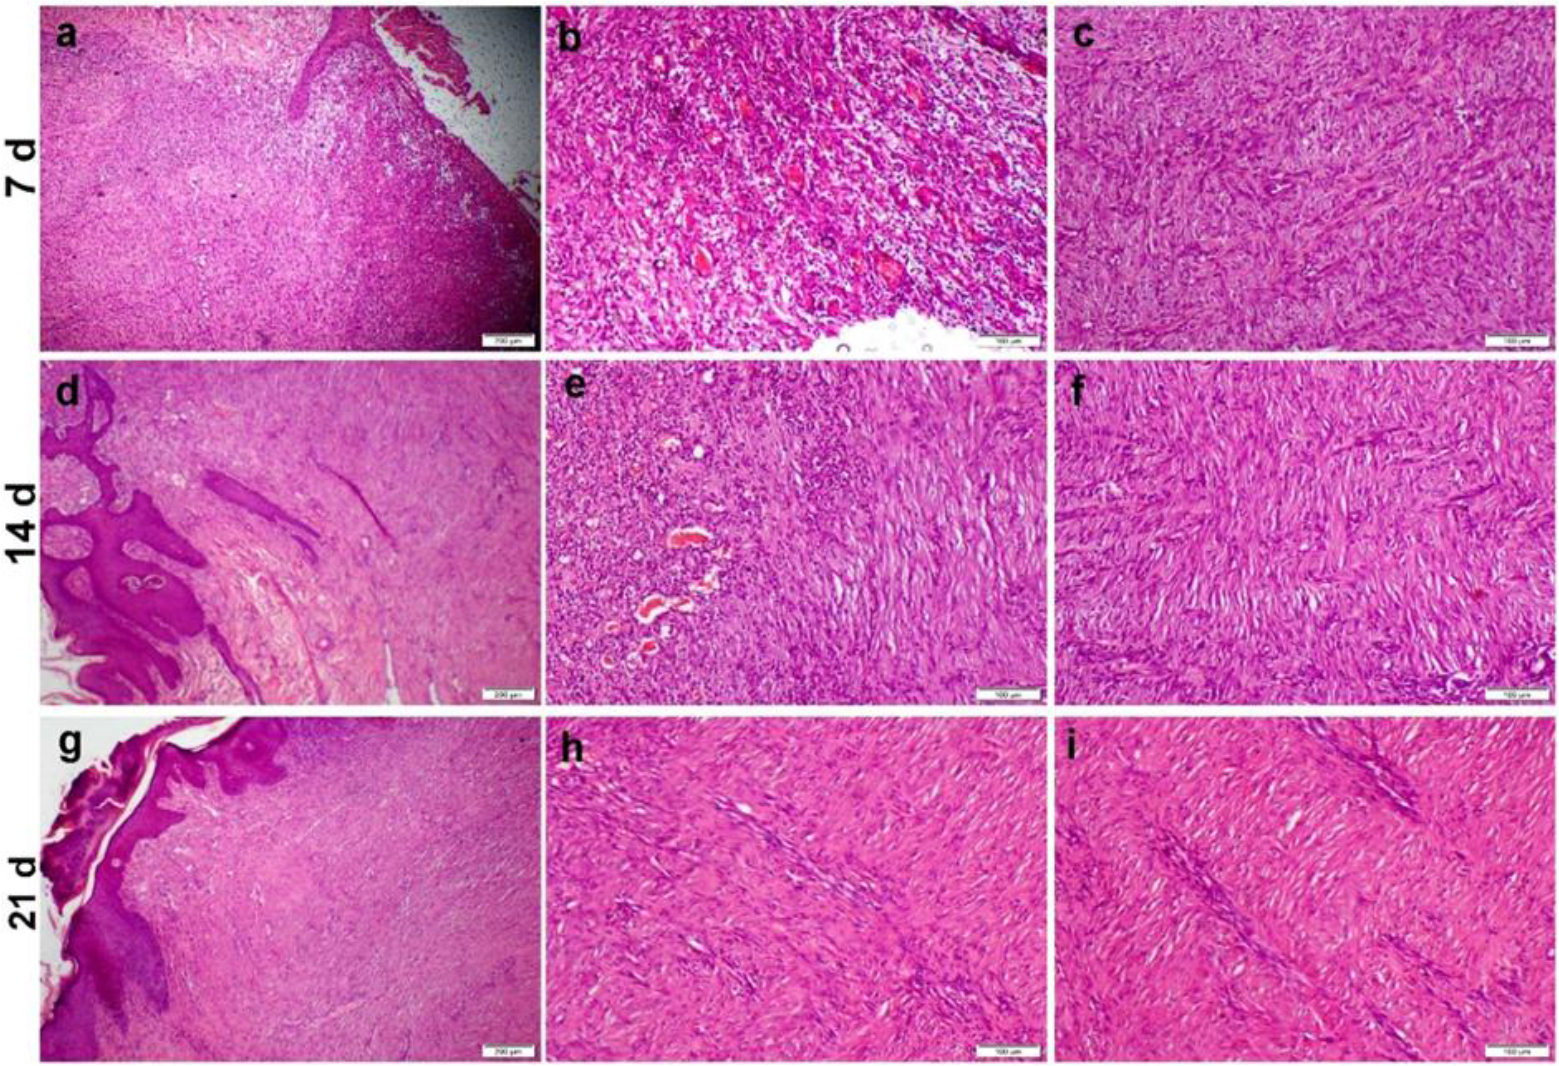
Fig. 5.
Photomicrographs of HE-stained dog skin wound sections obtained from the chitosan-coated zinc-oxide nanoparticle subcutaneously injected group treated at 25 ppm once a week for two weeks. a–c – wound area on the 7th day post treatment (PT) showing severe inflammation, early onset of regeneration, angiogenesis and granulation tissue formation; d–f – wound area on the 14th day PT showing complete re-epithelialisation, prominent angiogenesis, granulation tissue formation and collagen deposition; g–i – wound area on the 21st day PT showing complete re-epithelialisation, granulation tissue formation and more collagen deposition
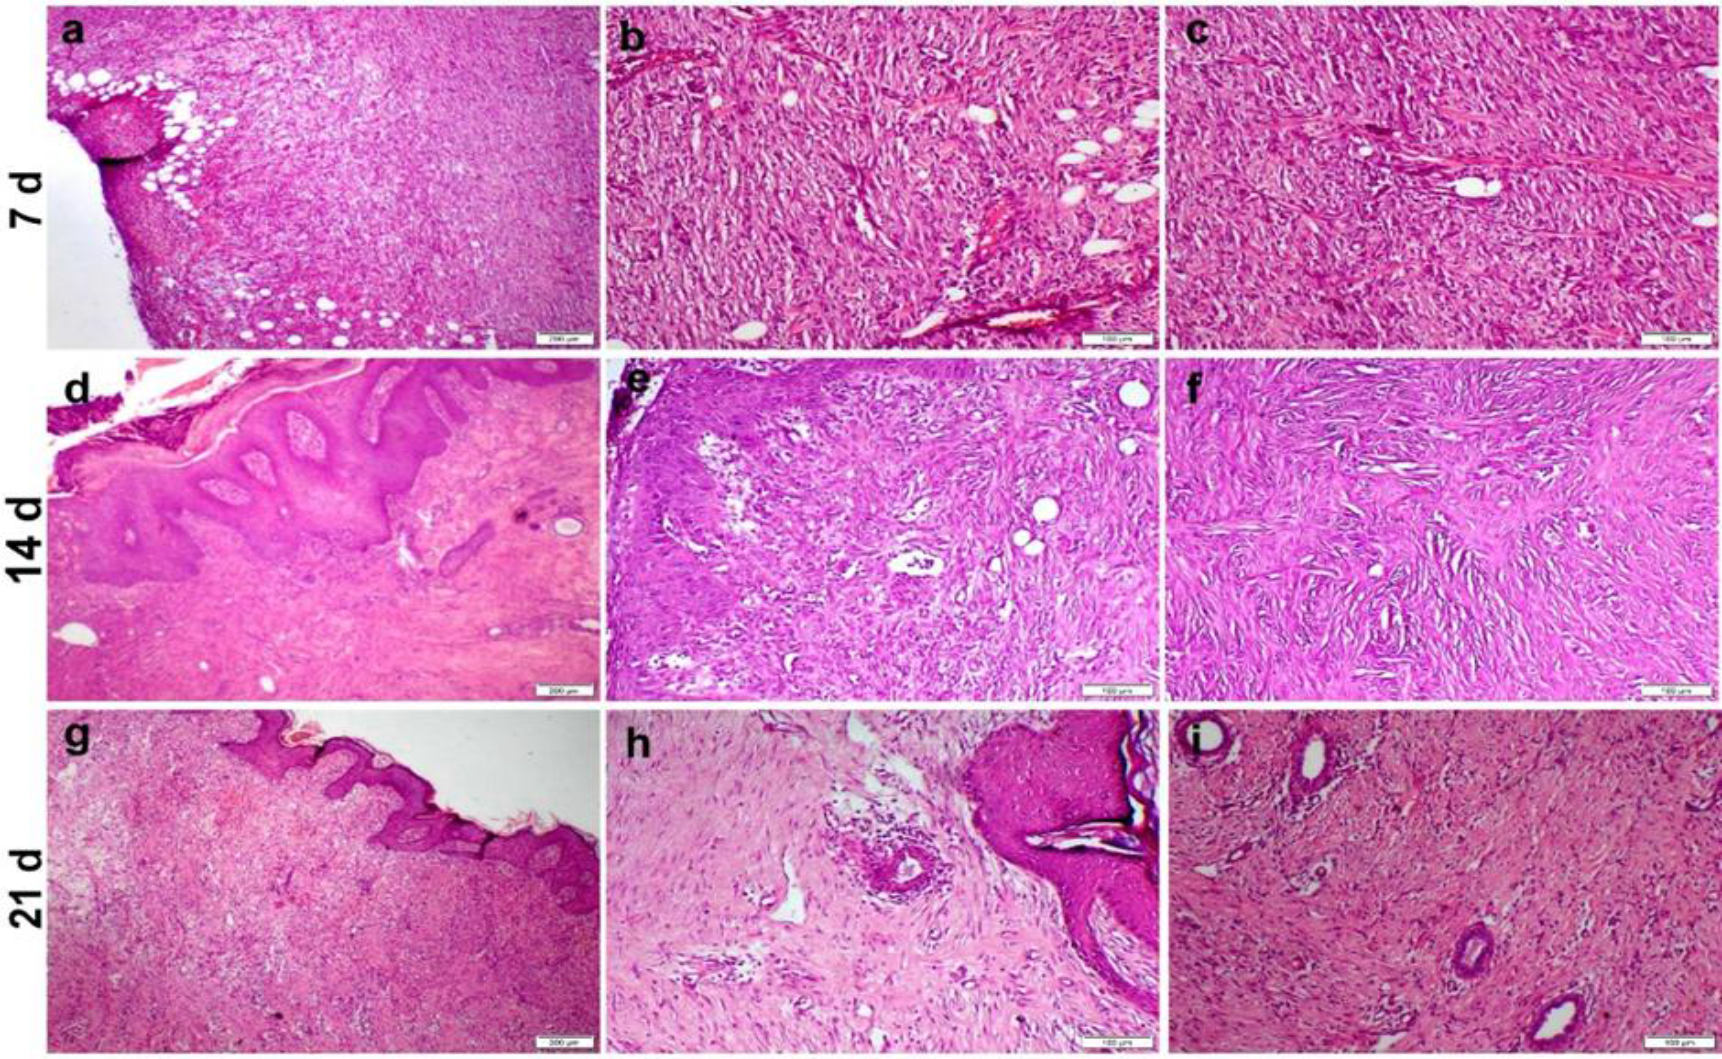
Fig. 6.
Photomicrographs of HE-stained dog skin wound sections obtained from the chitosan-coated zinc-oxide nanoparticle topically treated group having applications at 25 ppm daily for two weeks. a–c – wound area on the 7th day post treatment (PT) showing early onset of angiogenesis and granulation tissue formation; d–f – wound area on the 14th day PT showing complete re-epithelialisation, organised tissue formation and less scar tissue formation; g–i – wound area on the 21st day PT showing less scar tissue formation and the formation of skin appendages
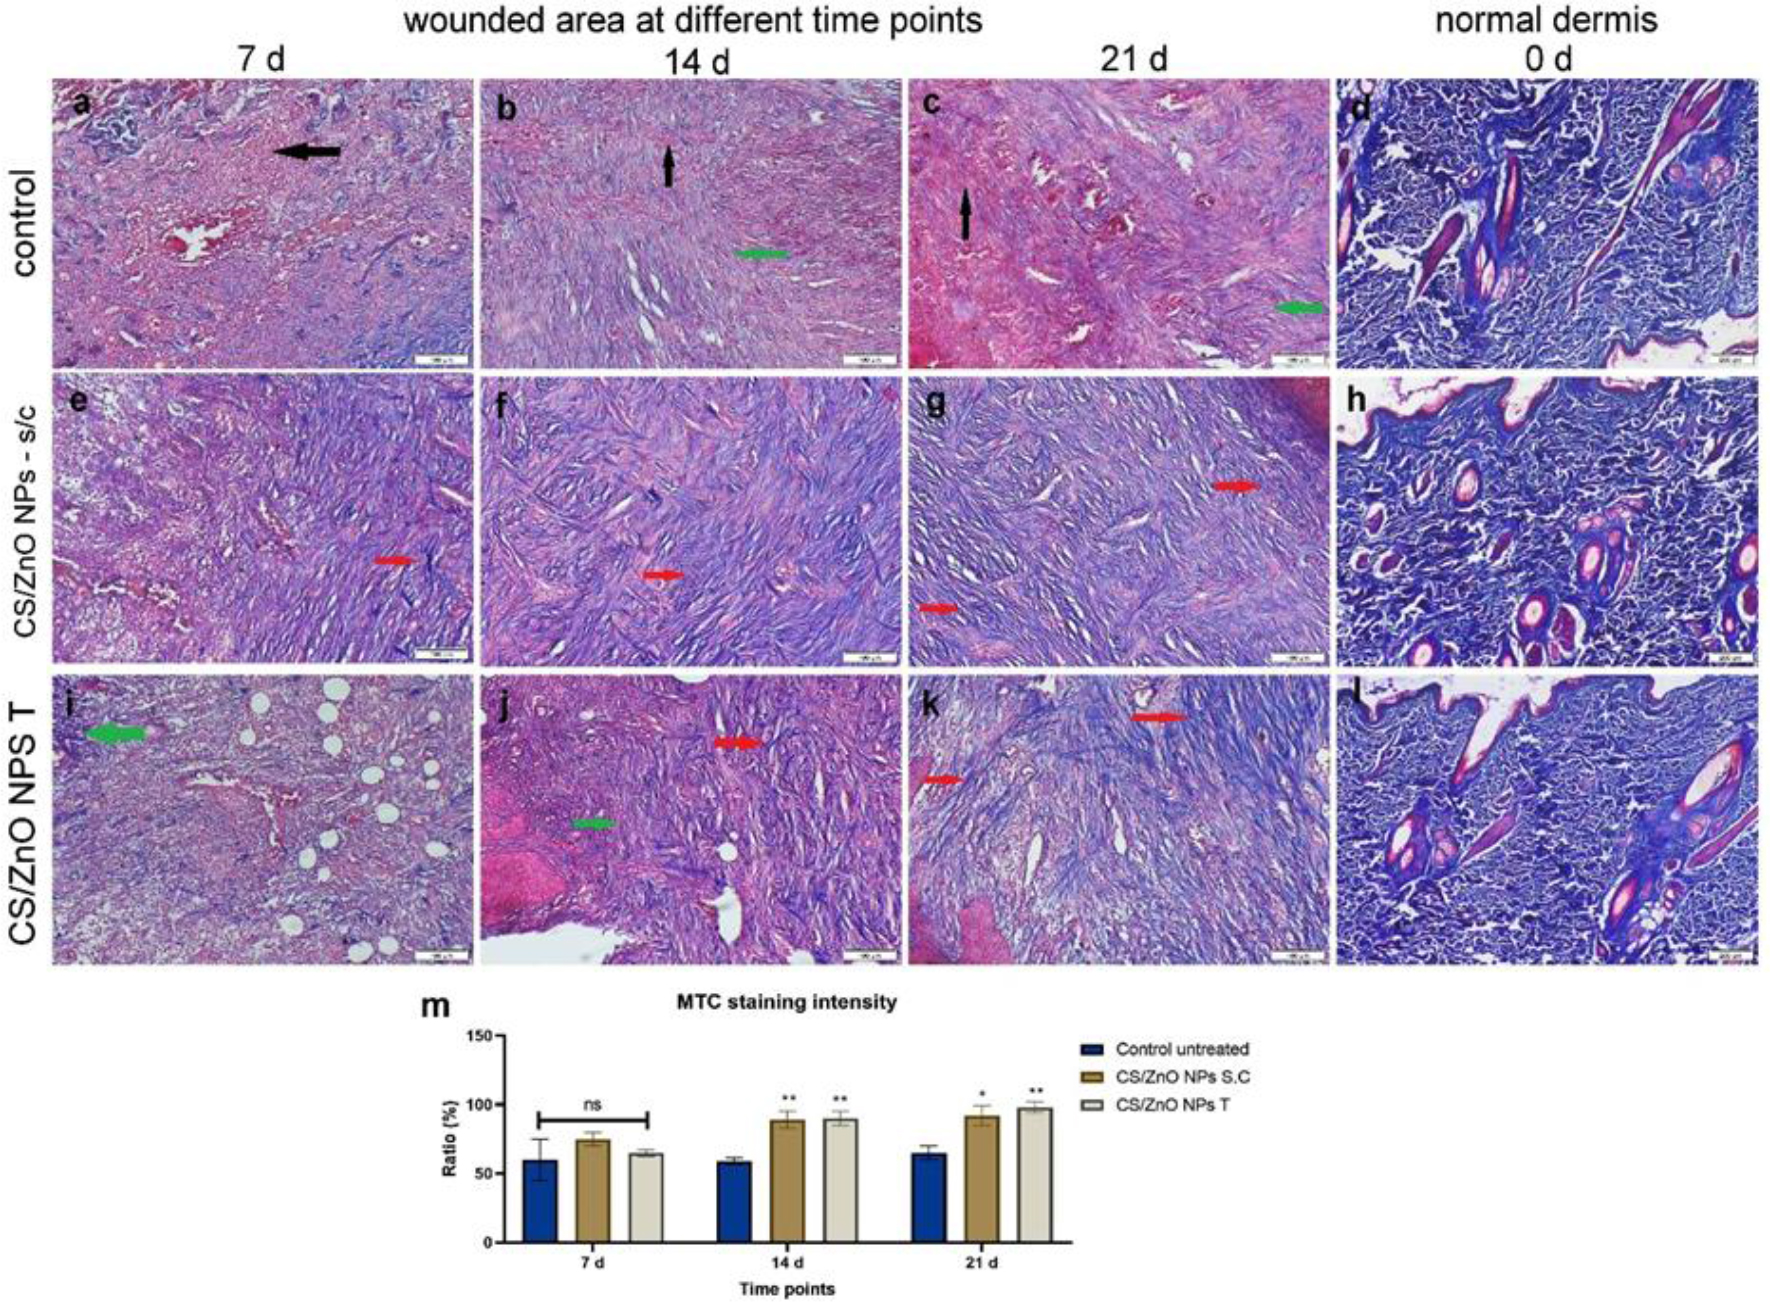
Fig. 7.
Photomicrographs of MTC-stained dog skin wound sections obtained from the control untreated group, the chitosan-coated zinc-oxide nanoparticle (CS/ZnO NP) subcutaneously injected (s/c) group treated at 25 ppm once a week for two weeks and the CS/ZnO NP topically (T) treated group having applications at 25 ppm daily for two weeks. d, h and l – normal skin on day 0 showing normal, dark-blue-stained collagen fibres arranged in wavy bundles; a–c – wound area of the control untreated group on the 7th, 14th and 21st days post treatment (PT); e–g – wound area of the CS/ZnO NPs s/c treated group on the 7th, 14th and 21st days PT; i–k – wound area of the CS/ZnO NPs T treated group on the 7th, 14th and 21st days PT. Black arrows – pink degenerated collagen fibres; green arrows – faint blue irregularly arranged collagen fibres; red arrows – dark-blue regularly arranged collagen fibres; m – Bar chart representing MTC staining intensity in each treatment group on the 7th, 14th and 21st days PT. */** – significant difference between groups at the same time point at P-value ≤ 0.05/≤ 0.01, respectively; ns – nonsignificant difference. Values are expressed as mean ± SEM
Table 5.
Histological grading of dog skin wound healing across group treated or not treated with chitosan-coated zinc-oxide nanoparticles (CS/ZnO NPs)
| Untreated | CS/ZnO NP s/c | CS/ZnO NPs T | |
|---|---|---|---|
| Day 7 re-epithelialisation | – | + | ++ |
| Day 7 inflammation | +++ | ++++ | ++++ |
| Day 7 fibroplasia | – | ++ | +++ |
| Day 7 angiogenesis | – | ++ | +++ |
| Day 7 collagen deposition | – | ++ | +++ |
| Day 14 re-epithelialisation | – | +++ | ++++ |
| Day 14 inflammation | ++++ | ++ | ++ |
| Day 14 fibroplasia | ++ | ++++ | ++++ |
| Day 14 angiogenesis | + | ++++ | ++++ |
| Day 14 collagen deposition | ++ | ++++ | ++++ |
| Day 21 re-epithelialisation | ++++ | ++++ | ++++ |
| Day 21 inflammation | + | + | – |
| Day 21 fibroplasia | ++++ | +++ | + |
| Day 21 angiogenesis | +++ | +++ | + |
| Day 21 collagen deposition | +++ | ++++ | ++ |
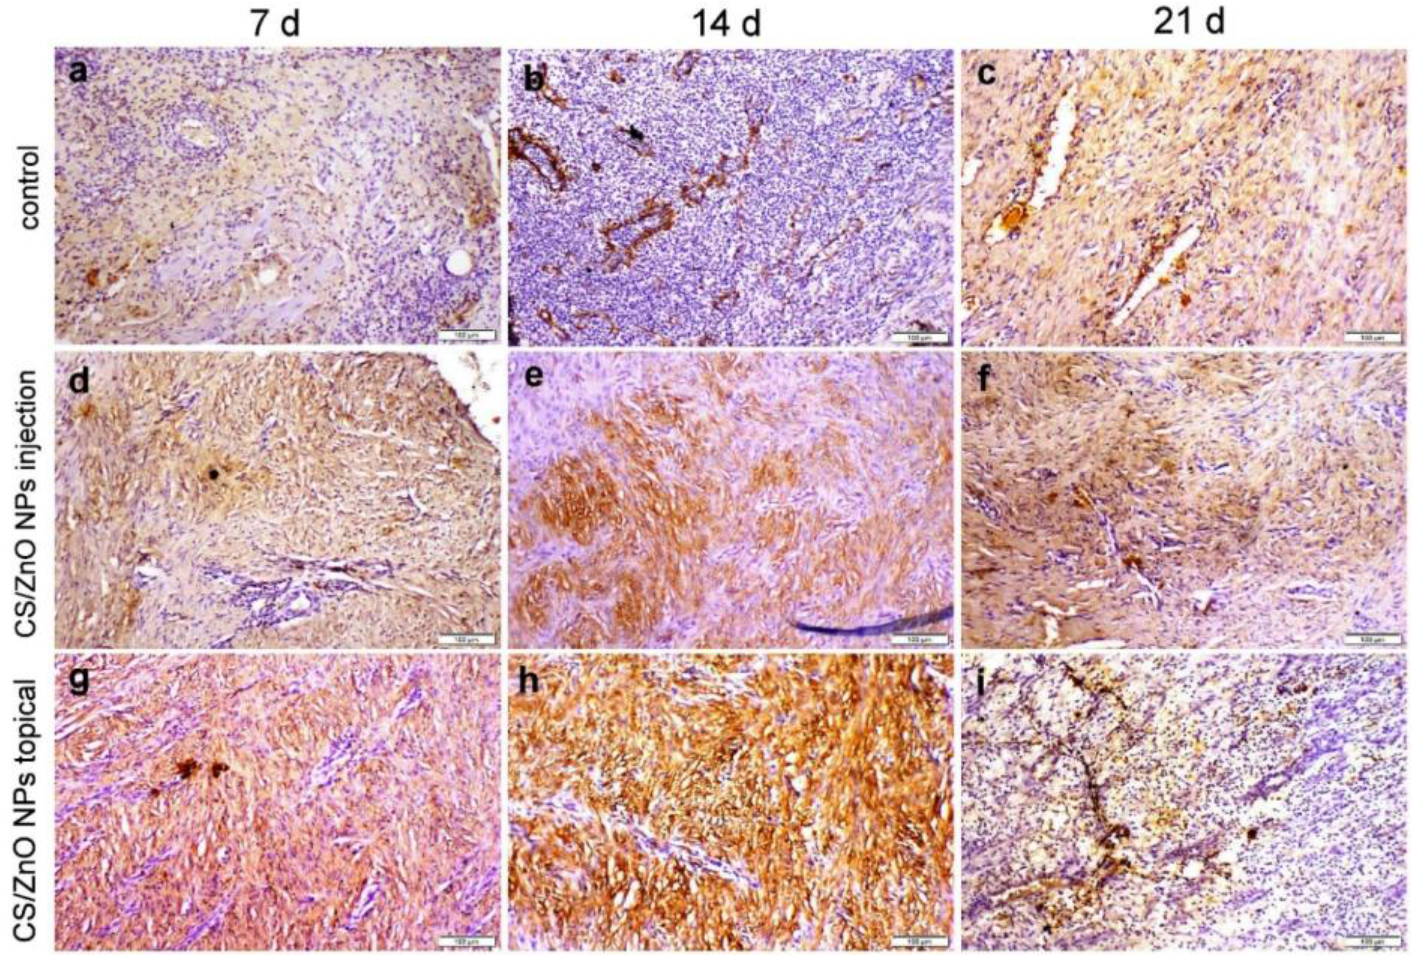
Fig. 8.
Vascular endothelial growth factor localisation in dog skin wound areas in the control untreated group, the chitosan-coated zinc-oxide nanoparticle (CS/ZnO NP) subcutaneously injected (s/c) group treated at 25 ppm once a week for two weeks and the CS/ZnO NP topically (T) treated group having applications at 25 ppm daily for two weeks. a–c – control untreated group on the 7th, 14th and 21st days post treatment (PT); d–f – CS/ZnO NP s/c treated group on the 7th, 14th and 21st days PT; g–i – CS/ZnO NP T treated group on the 7th, 14th and 21st days PT
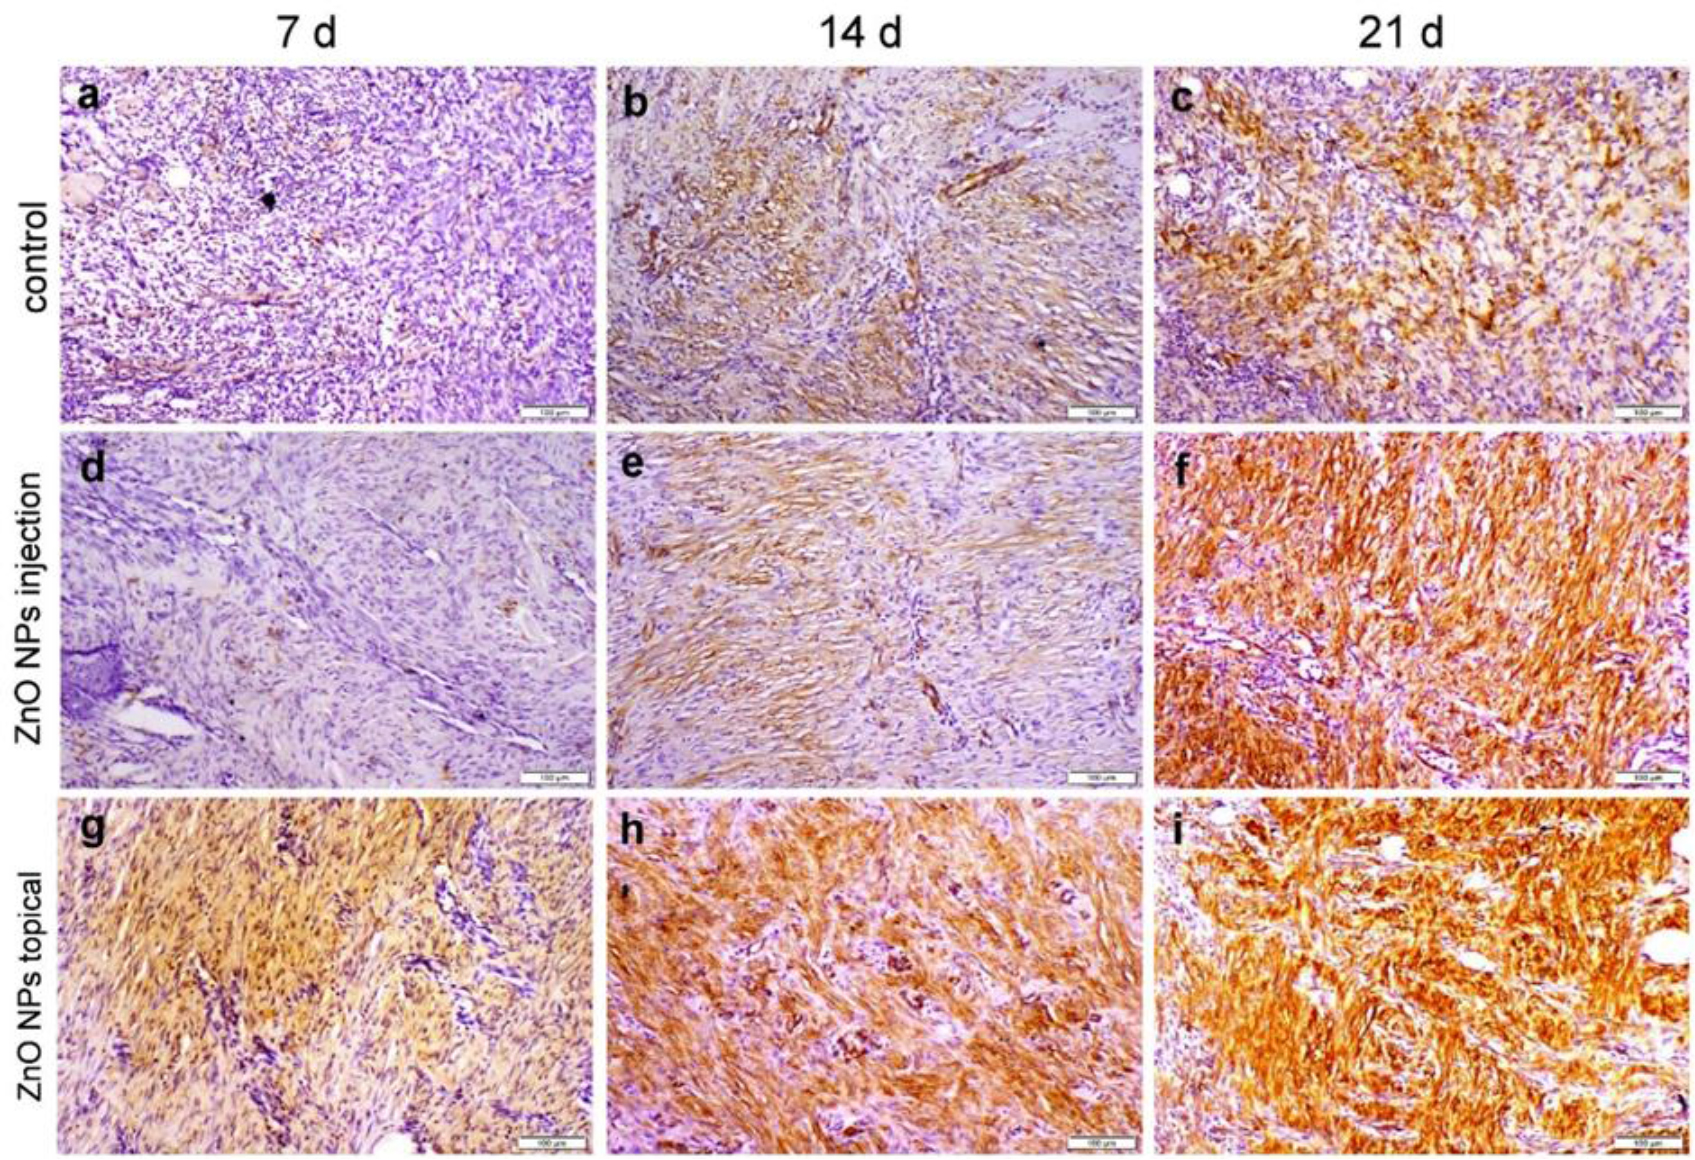
Fig. 9.
α-smooth muscle actin localisation in dog skin wound areas in the control untreated group, the chitosan-coated zinc-oxide nanoparticle (CS/ZnO NP) subcutaneously injected (s/c) group treated at 25 ppm once a week for two weeks and the CS/ZnO NP topically (T) treated group having applications at 25 ppm daily for two weeks. a–c – control untreated group on the 7th, 14th and 21st days post treatment (PT); d–f – CS/ZnO NP s/c treated group on the 7th, 14th and 21st days PT; g–i – CS/ZnO NP T treated group on the 7th, 14th and 21st days PT
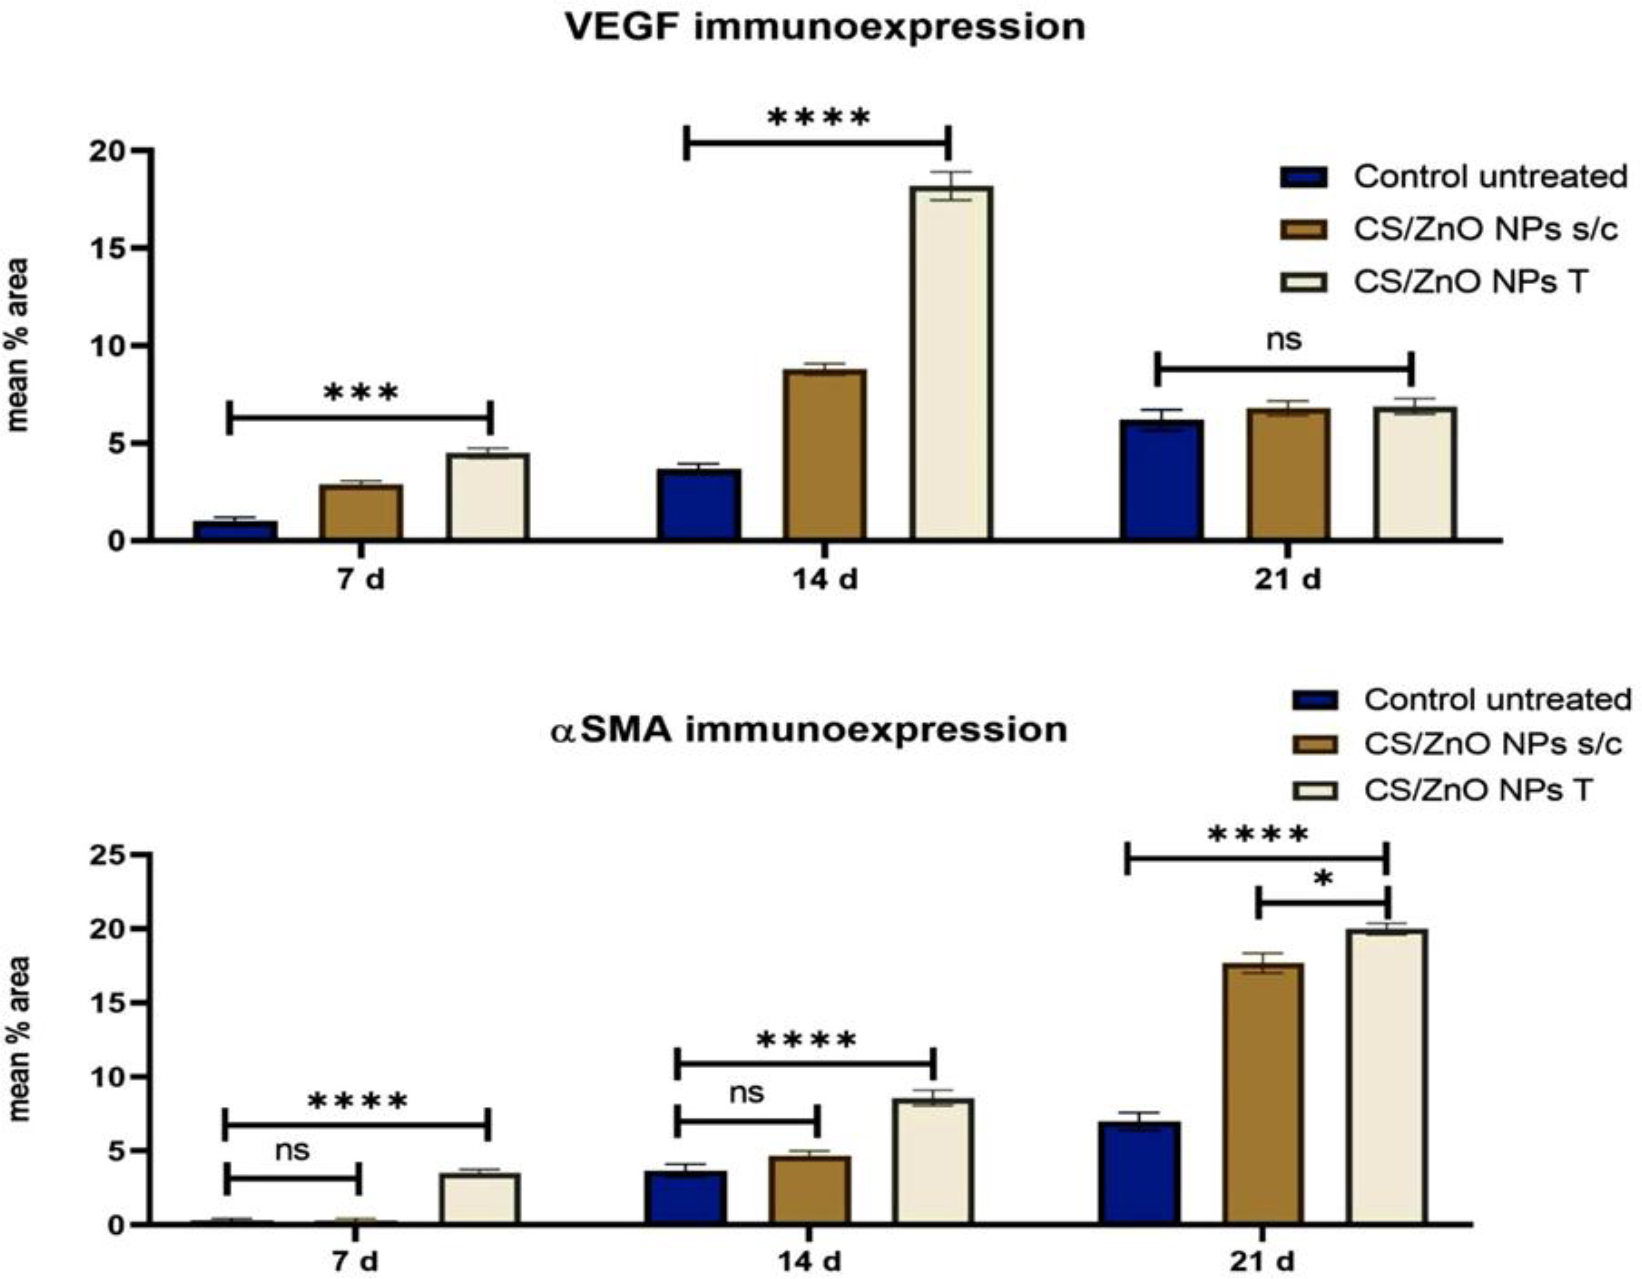
Fig. 10.
Bar chart representing the mean percentage of the tissue section area positive for vascular endothelial growth factor (VEGF) and α-smooth muscle actin (aSMA) immunoexpression in the control untreated group, the chitosan-coated zinc-oxide nanoparticle (CS/ZnO NP) subcutaneously injected (s/c) group treated at 25 ppm once a week for two weeks and the CS/ZnO NP topically (T) treated group having applications at 25 ppm daily for two weeks. Each group’s data are given on the 7th, 14th and 21st days post treatment. */***/**** – significant difference between groups at the same time point (P-value ≤ 0.05/≤ 0.001/≤ 0.0001. Values are expressed as mean ± S