
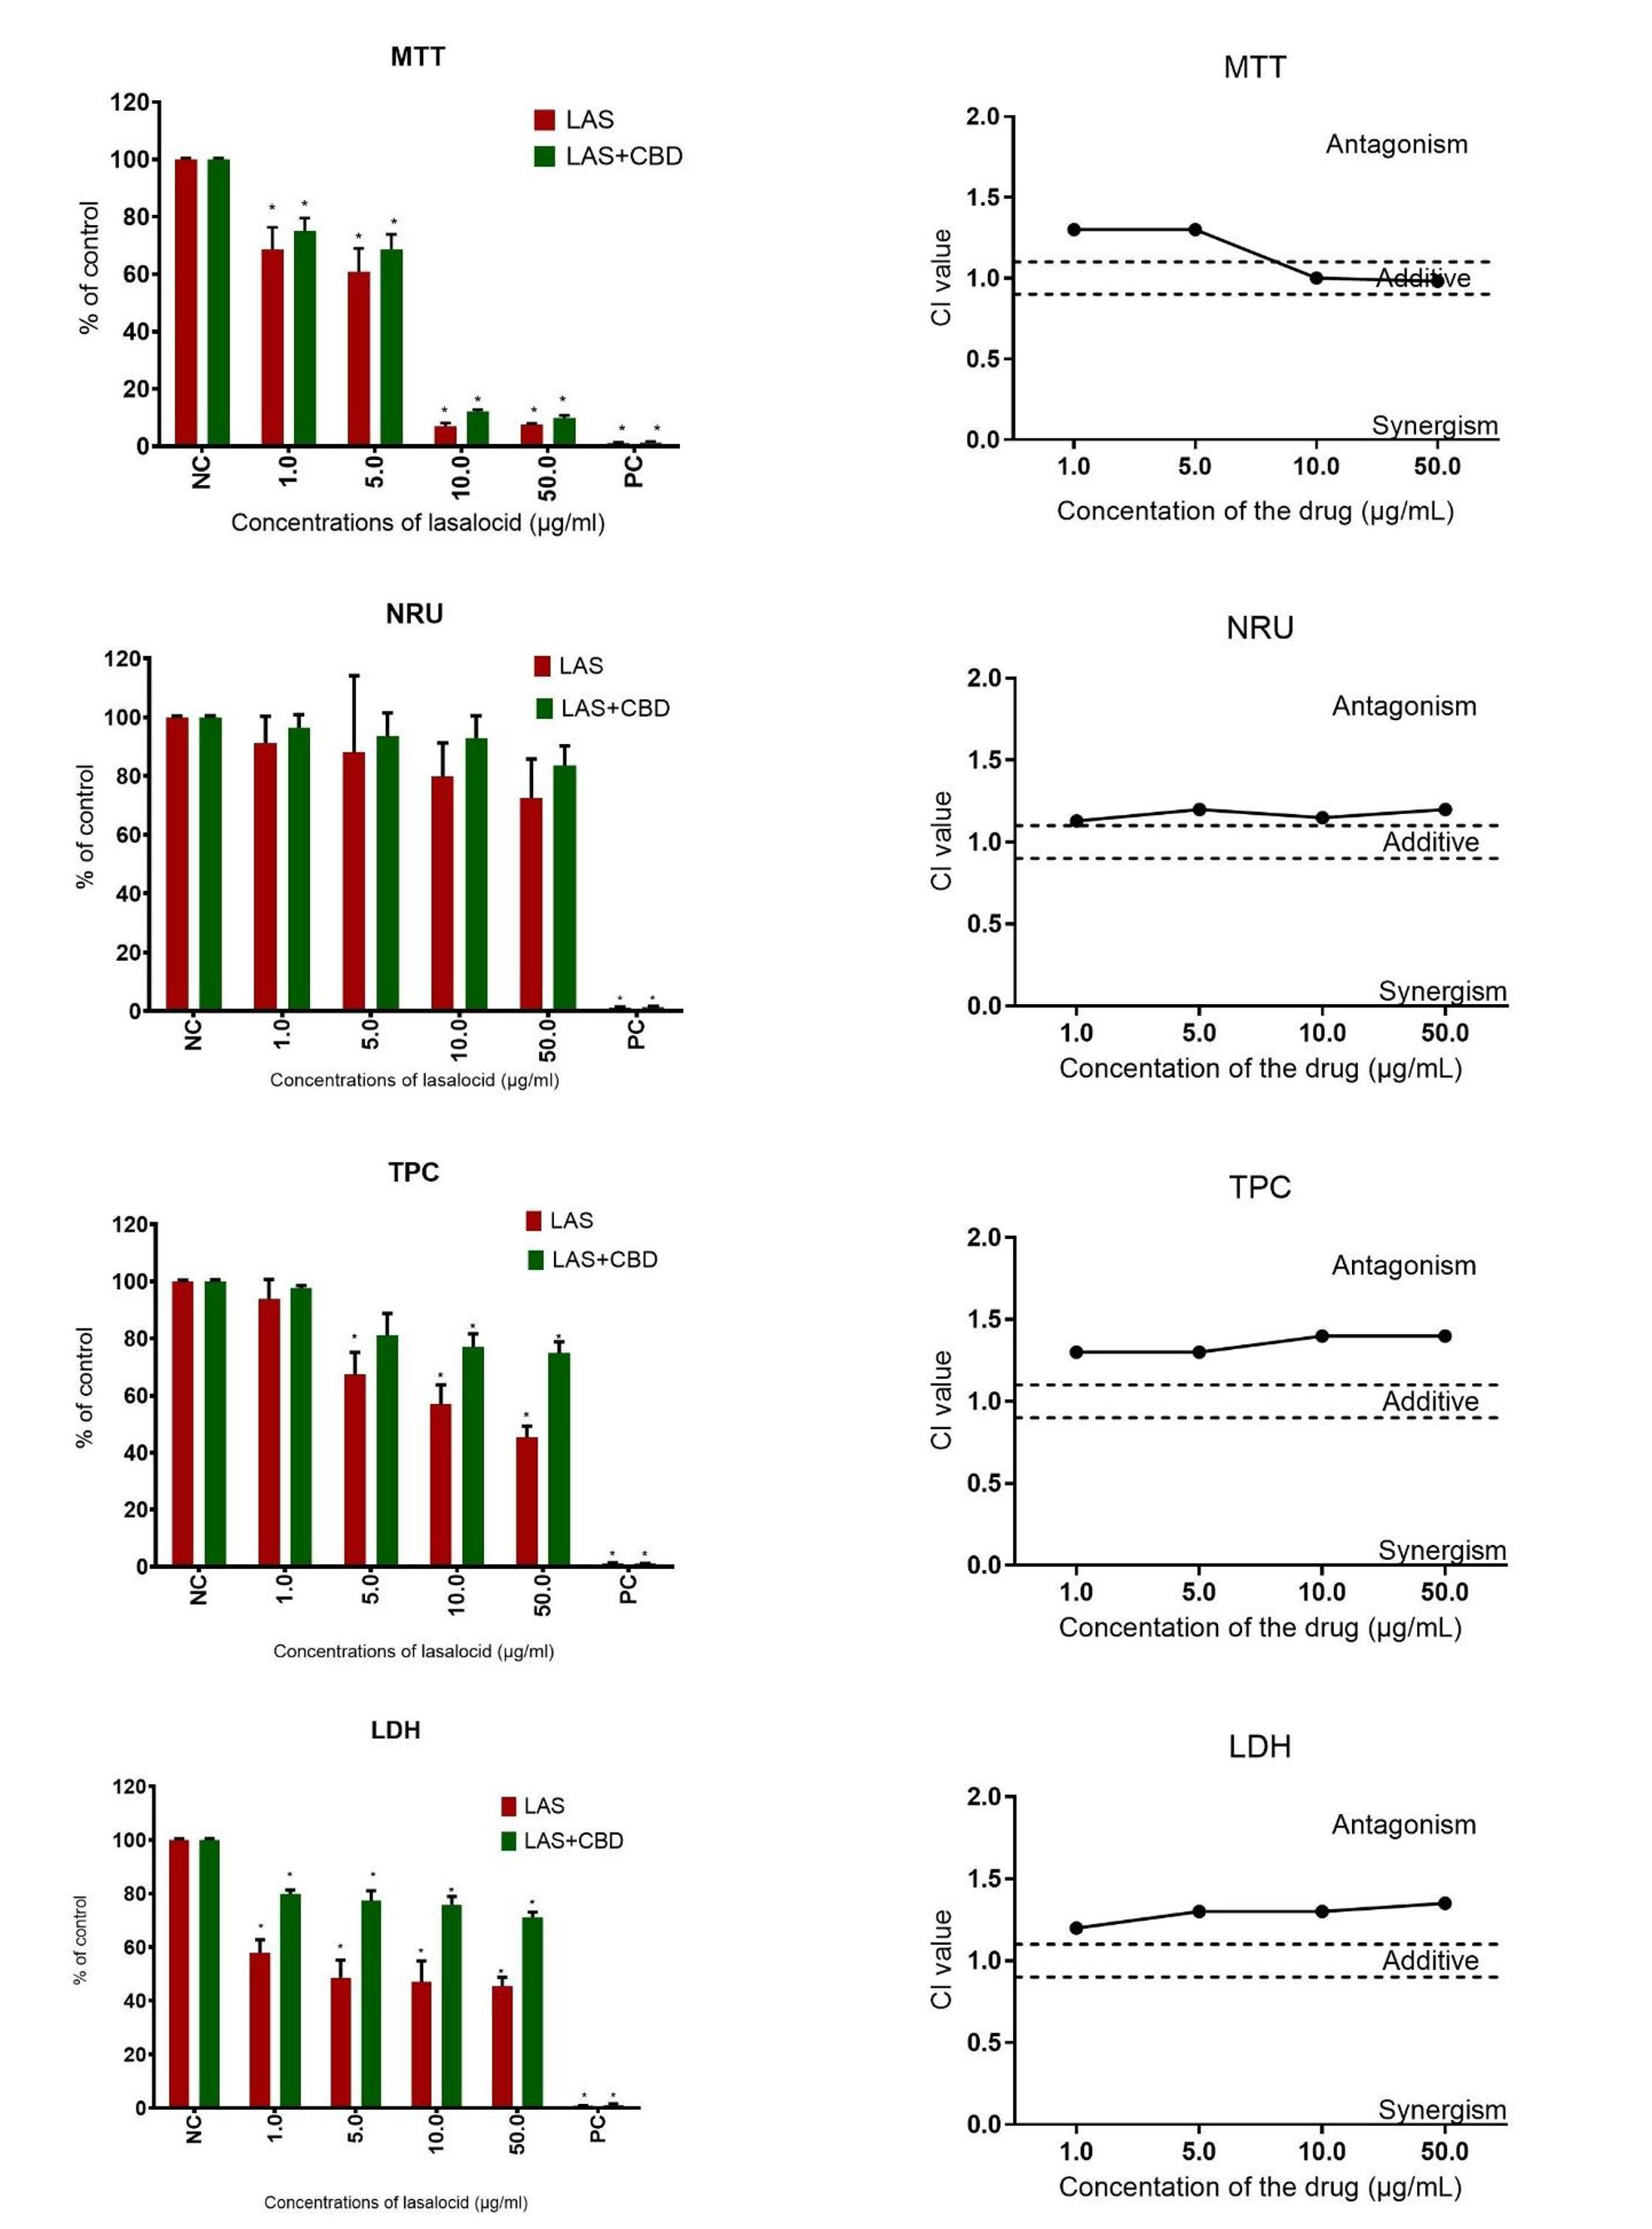
Fig. 1.
Effects of the joint action of lasalocid (LAS) and cannabidiol (CBD) on human embryonic kidney HEK-293 cell viability. The cytotoxicity and character of interaction was assessed using 3-[4,5-dimethylthiazol-2-yl]-2,5-diphenyltetrazolium bromide (MTT), neutral red uptake (NRU), total protein content (TPC) and lactate dehydrogenase (LDH) assays following a 72-h exposure period. Vertical bars represent 95% confidence intervals for the combination index (CI) values, calculated via sequential deletion analysis. The horizontal dashed line (CI = 0.9–1.1) indicates the additive threshold, where values below the line signify synergism and values above signify antagonism. Data are expressed as mean ± SD from three independent experiments (n = 3). NC – negative control; PC – positive control; * – statistical significance at P-value ≤ 0.05
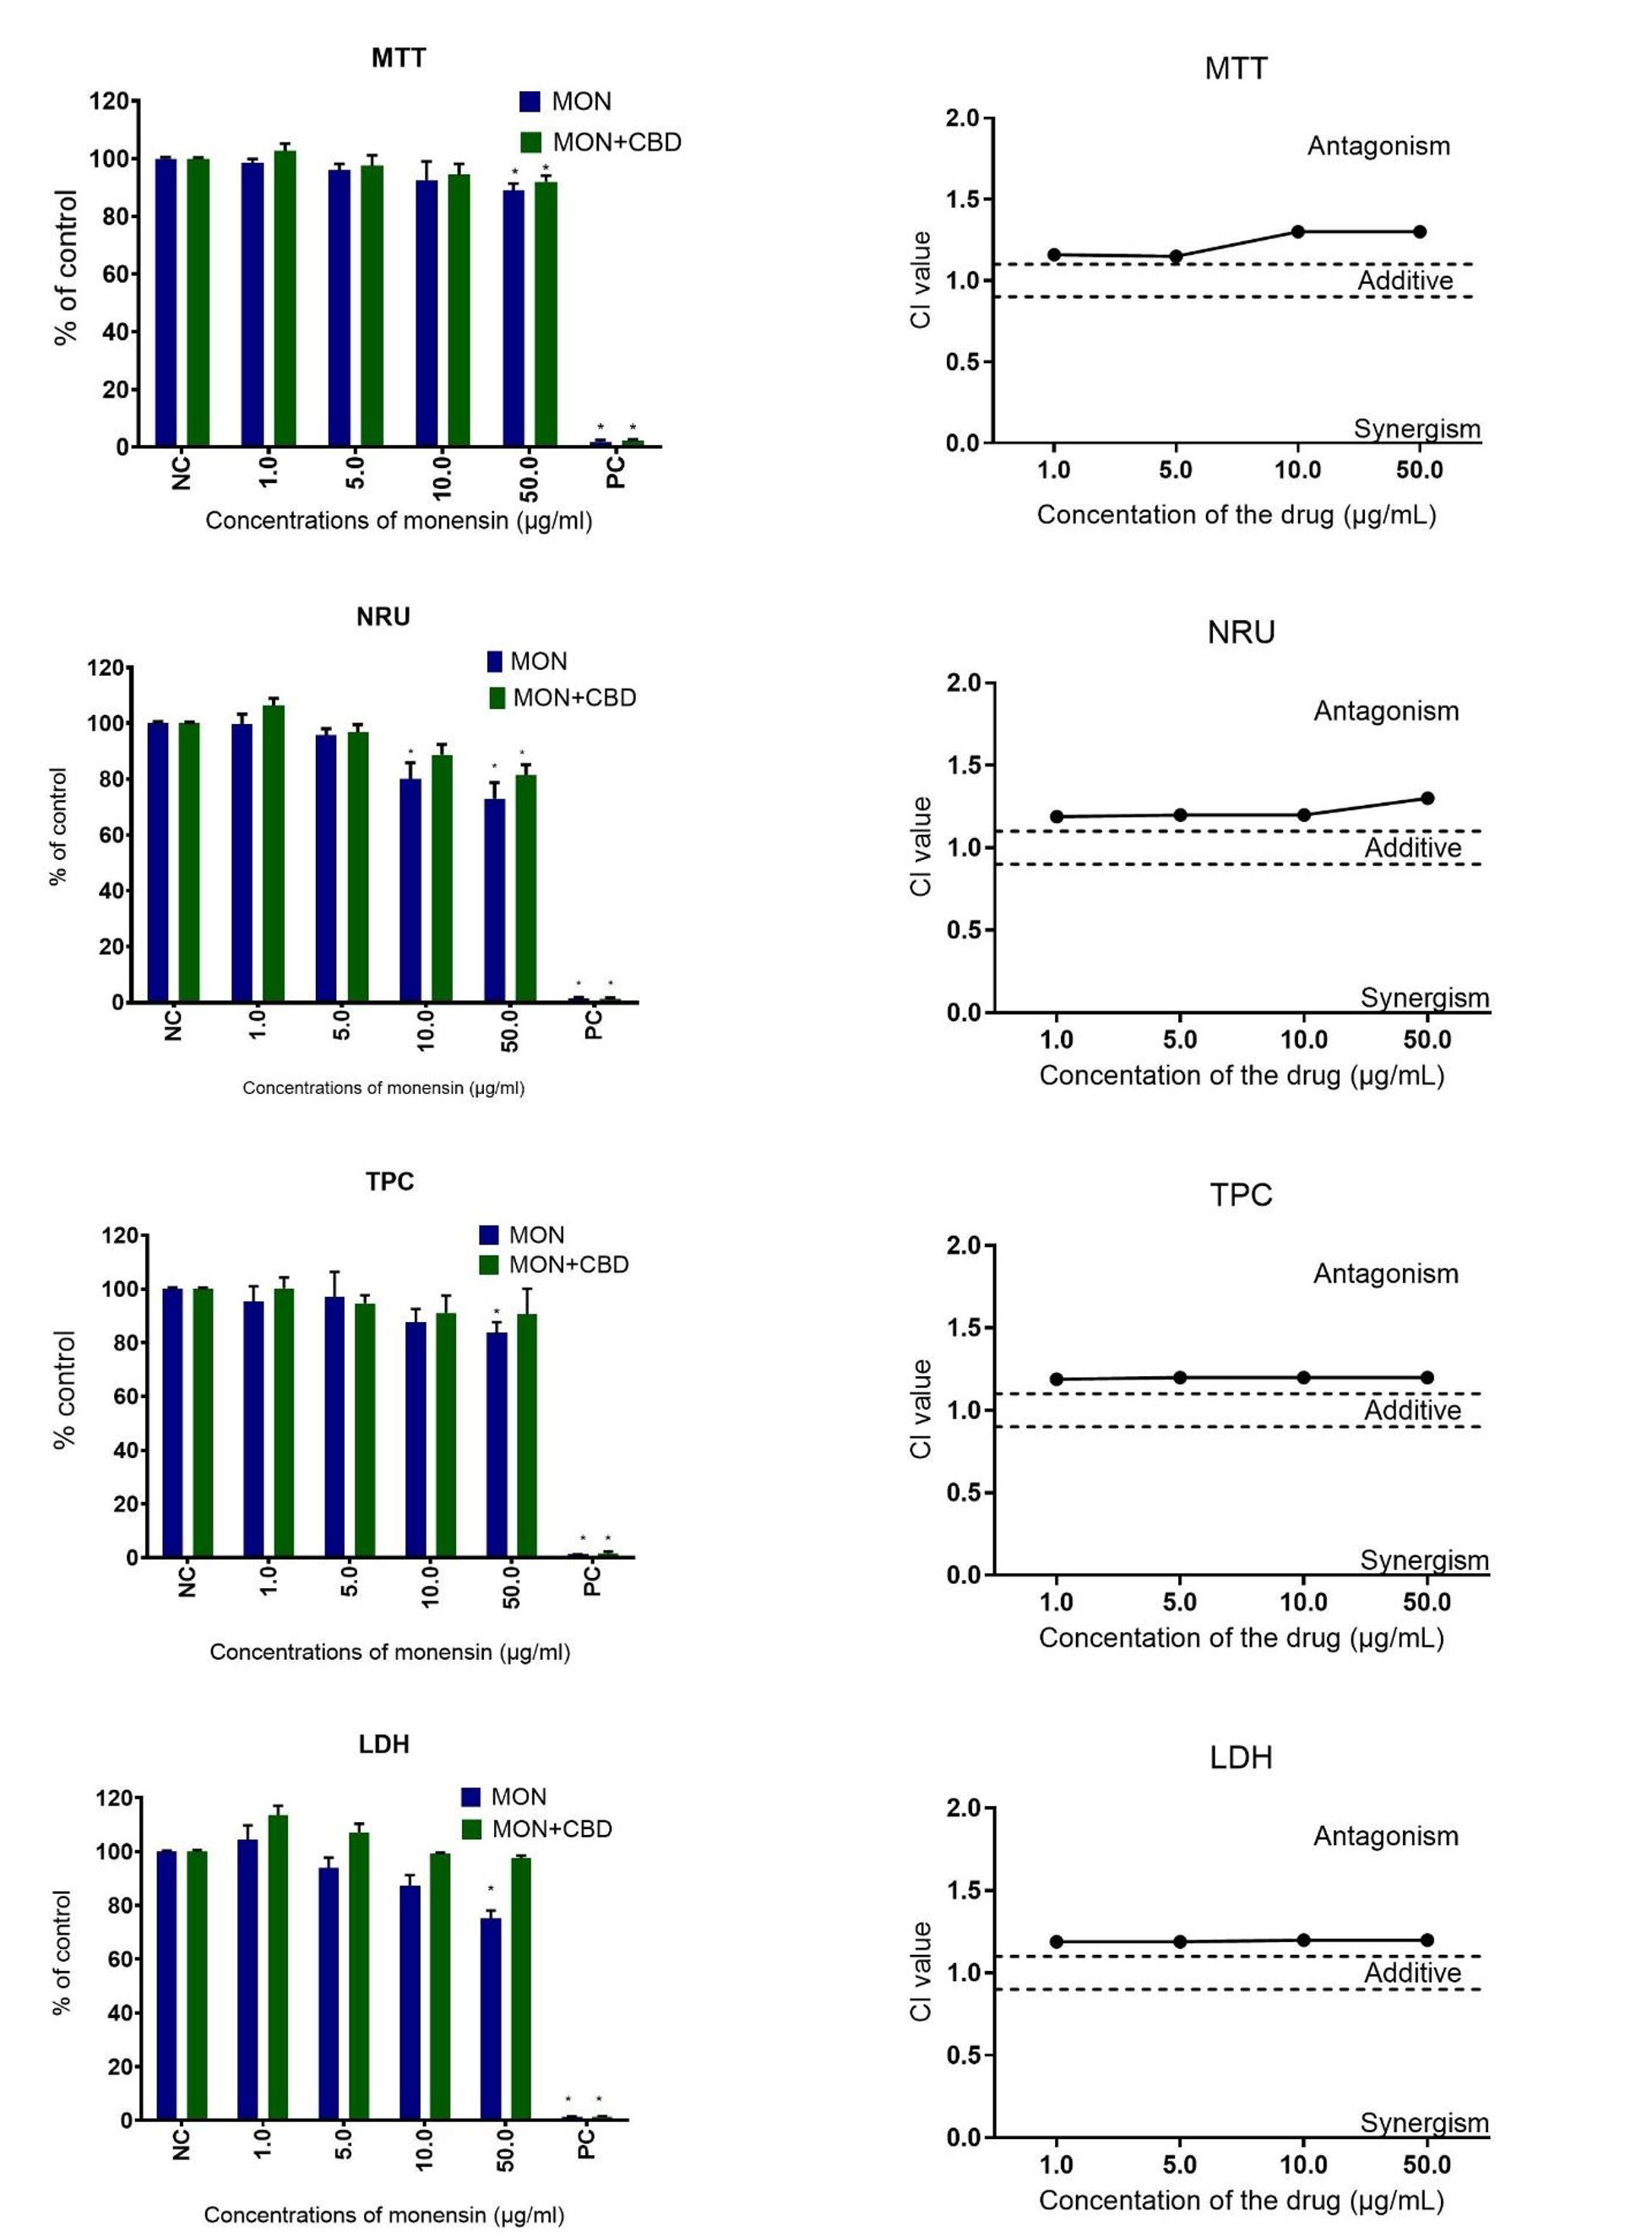
Fig. 2.
Effects of the joint action of monensin (MON) and cannabidiol (CBD) on human embryonic kidney HEK-293 cell viability. The cytotoxicity and character of interaction was assessed using 3-[4,5-dimethylthiazol-2-yl]-2,5-diphenyltetrazolium bromide (MTT), neutral red uptake (NRU), total protein content (TPC) and lactate dehydrogenase (LDH) assays following a 72-h exposure period. Vertical bars represent 95% confidence intervals for the combination index (CI) values, calculated via sequential deletion analysis. The horizontal dashed line (CI = 0.9–1.1) indicates the additive threshold, where values below the line signify synergism and values above signify antagonism. Data are expressed as mean ± SD from three independent experiments (n = 3). NC – negative control; PC – positive control; * – statistical significance at P-value ≤ 0.05
Table 1.
Half-maximal inhibitory concentration values (µg/mL) calculated in human embryonic kidney HEK-293 cell cultures after 72-h exposure to lasalocid (LAS), monensin (MON), narasin (NAR) and their mixtures with cannabidiol (CBD)
| Method | LAS | LAS + CBD | MON | MON + CBD | NAR | NAR + CBD |
|---|---|---|---|---|---|---|
| MTT | 8.0 ± 1.6 | 8.4 ± 0.3 | > 50 | > 50 | 5.7 ± 0.4 | 45.6 ± 9.5 |
| NRU | > 50 | > 50 | > 50 | > 50 | > 50 | > 50 |
| TPC | 27.9 ± 10.5 | > 50 | > 50 | > 50 | > 50 | > 50 |
| LDH | 12.3 ± 2.8 | > 50 | > 50 | > 50 | > 50 | > 50 |
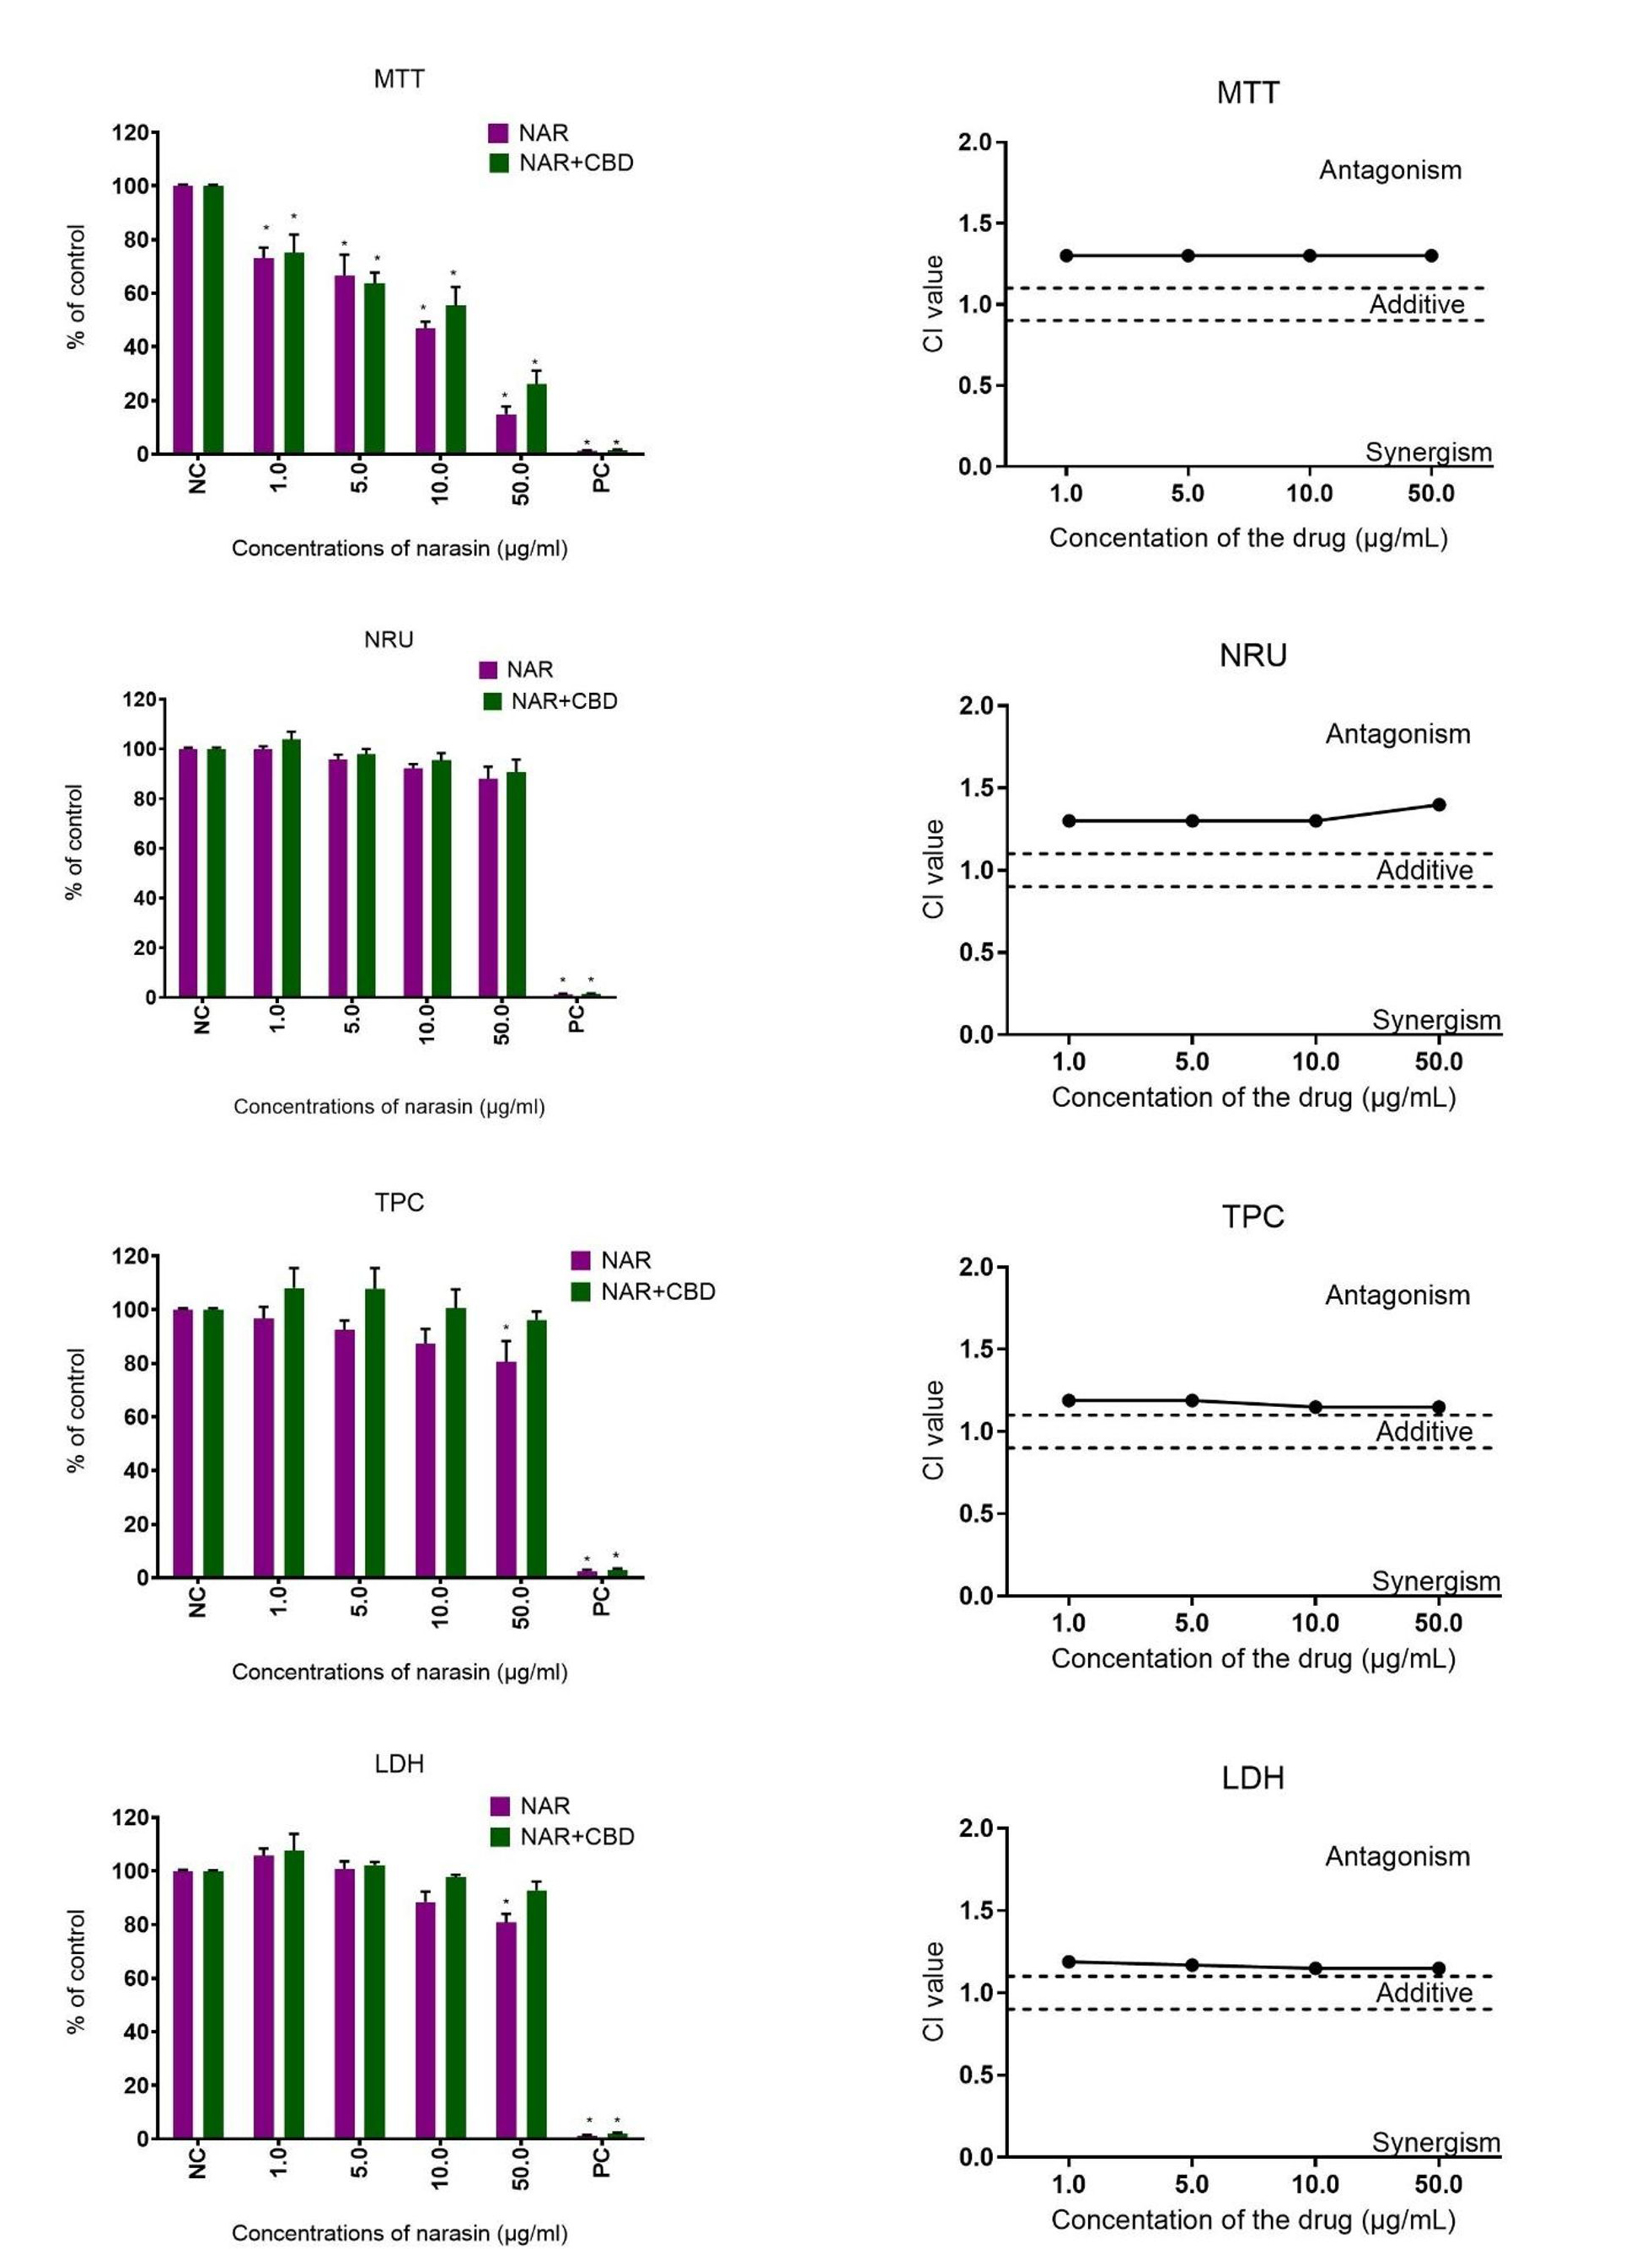
Fig. 3.
Effects of the joint action of narasin (NAR) and cannabidiol (CBD) on human embryonic kidney HEK-293 cell viability. The cytotoxicity and character of interaction was assessed using 3-[4,5-dimethylthiazol-2-yl]-2,5-diphenyltetrazolium bromide (MTT), neutral red uptake (NRU), total protein content (TPC) and lactate dehydrogenase (LDH) assays following a 72-h exposure period. Vertical bars represent 95% confidence intervals for the combination index (CI) values, calculated via sequential deletion analysis. The horizontal dashed line (CI = 0.9–1.1) indicates the additive threshold, where values below the line signify synergism and values above signify antagonism. Data are expressed as mean ± SD from three independent experiments (n = 3). NC – negative control; PC – positive control; * – statistical significance at P-value ≤ 0.05