
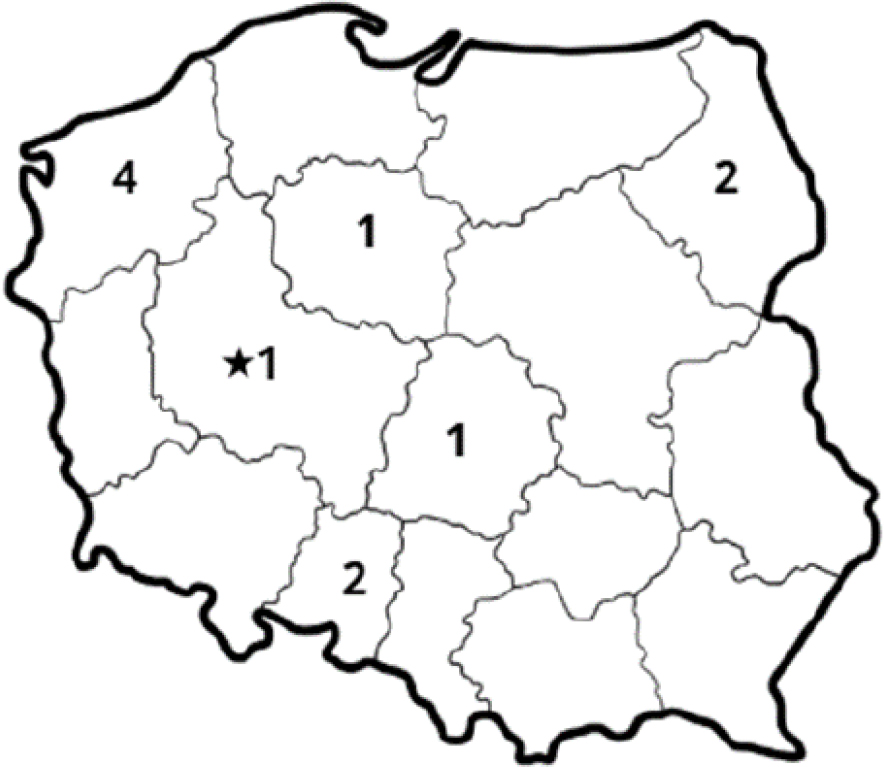
Fig. 1.
Number of pig farms sampled from each voivodeship for porcine circovirus 4 detection. The star indicates the voivodeship from which wildlife samples were obtained
Table 1.
Characteristics of samples collected from wild animals and analysed for porcine circovirus
| Species | Serum | Lymph nodes | Spleen | Lung | Total |
|---|---|---|---|---|---|
| Wild boar (Sus scrofa) | 18 | 16 | 20 | 20 | 74 |
| Fallow deer (Dama dama) | 30 | 19 | 32 | 33 | 114 |
| Roe deer (Capreolus capreolus) | 6 | 4 | 6 | 6 | 22 |
| Red deer (Cervus elaphus) | 4 | 4 | 4 | 4 | 16 |
Table 2.
Primers and probes designed for the study
| Name | Type | Sequence | Length (bp) | Position |
|---|---|---|---|---|
| PCV4 F | Forward Primer | GAAAGCGCAGCGACCTTA | 18 | 397–414 |
| PCV4 R | Reverse Primer | CCACGCCCATACCTTATAAAT | 21 | 482–502 |
| PCV4 probe | Probe | 6-Fam-TGGCCCGTCGTGAGTTCCCGTCT-BHQ-1 | 20 | 459–479 |
| PCV4 control | Positive control | GAAAGCGCAGCGACCTTAAAGCGGCTGTGGCCGCCCTGAATGCCGG CAGCTCAATGAGTGAAGTGGCCCGTGAGTTCCCGTCTGTATTTATAA GGTATGGGCGTGGCCTCCGGGACTACGTCATTACGC | 130 | 397–526 |
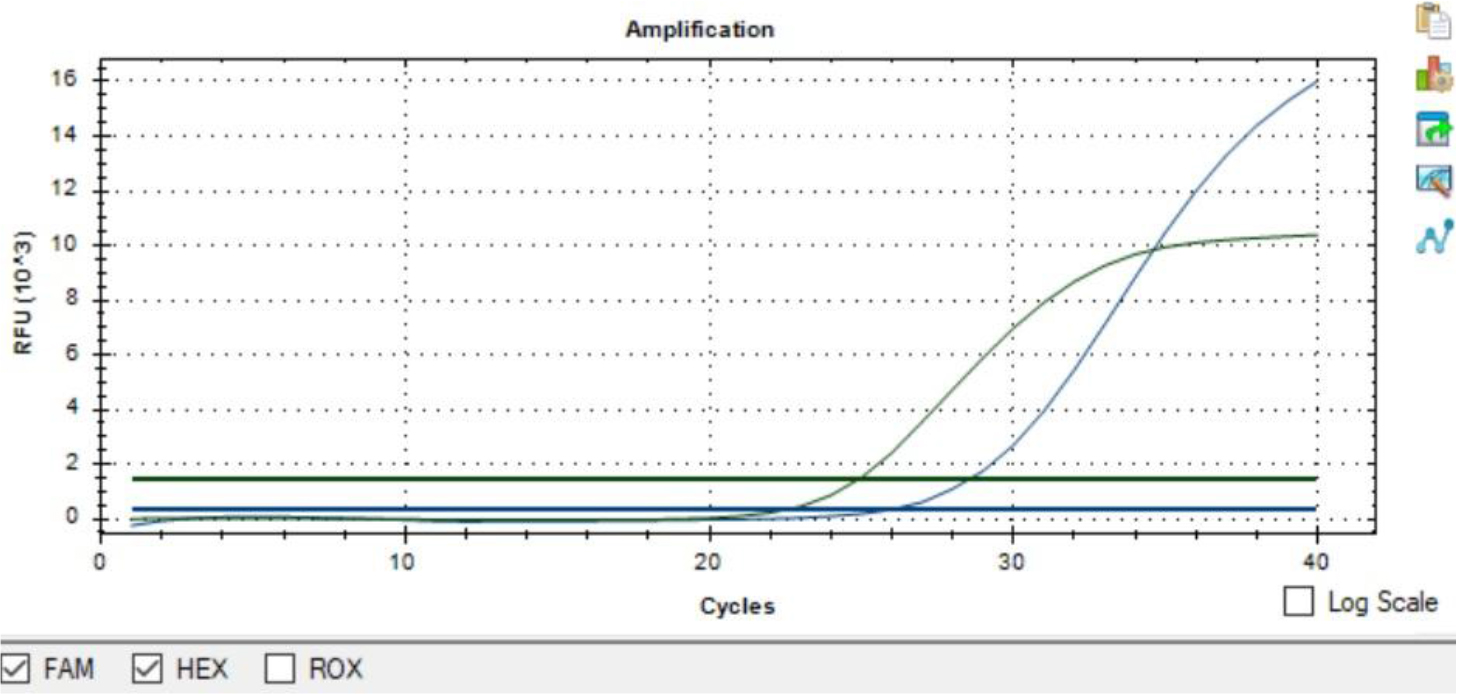
Fig. 2.
Representative real-time PCR amplification plot for PCV4 detection. The blue curve represents amplification of the PCV4 positive control detected in the FAM channel, while the green curve represents amplification of the internal control detected in the HEX channel
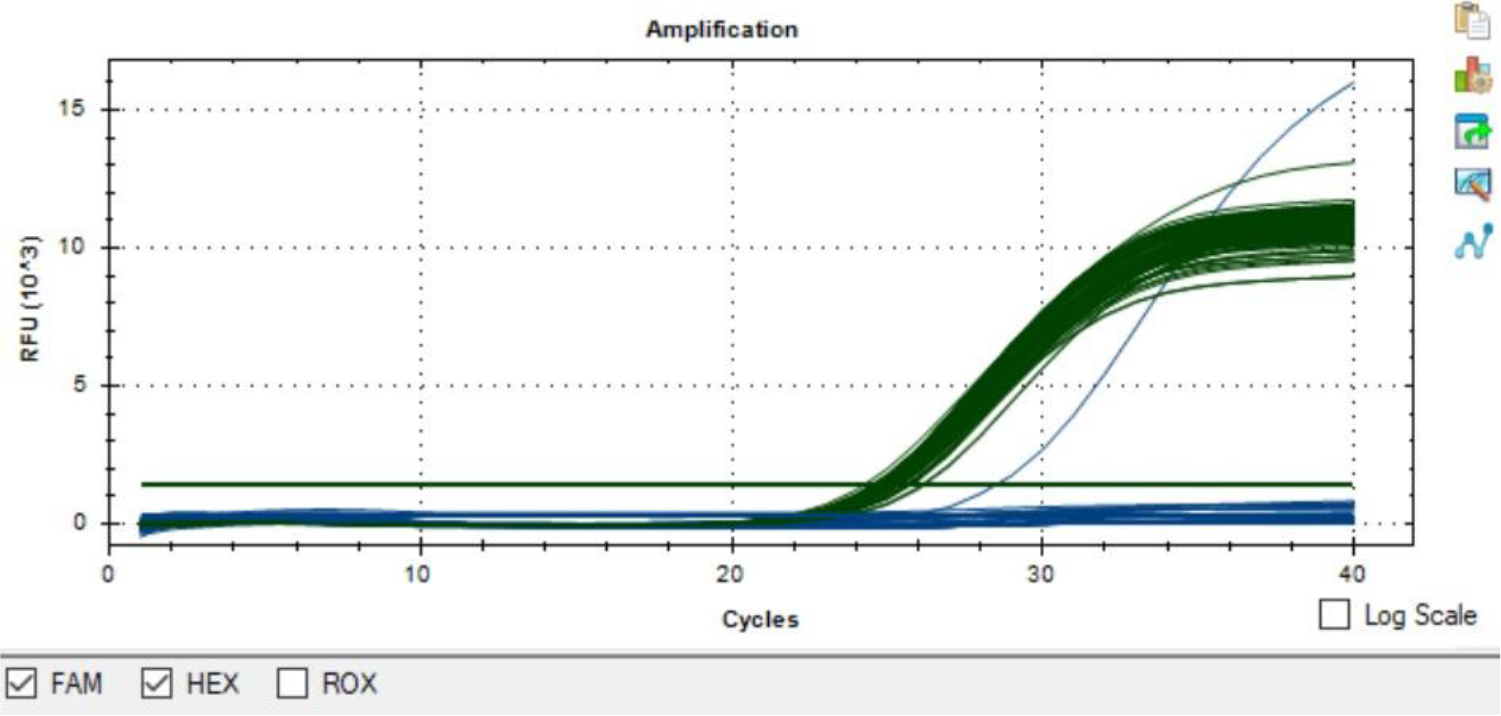
Fig. 3.
Representative real-time PCR amplification plot for PCV4 detection. The blue curve represents amplification of the PCV4 positive control in the FAM channel, while the green curves represent amplification of the internal control (IC) in the HEX channel in PCV4-negative samples. Successful IC amplification confirmed the validity of the negative results and indicated the absence of significant PCR inhibition