
Table 1.
Specimens of Ashworthius sidemi derived from cervids during post mortem examinations
| Period | Necropsy month | Hosts with infection (n) | Hosts with co-infection (n) | Mean intensity of infection | Adult-parasite mean intensity | Subadult-parasite mean intensity |
|---|---|---|---|---|---|---|
| Hot | May | 7 | 3 | 106 | 87 | 32 |
| Hot | June | 10 | 3 | 95 | 94 | 1 |
| Hot | July | 6 | 1 | 200 | 200 | 2 |
| Hot | August | 9 | 3 | 176 | 107 | 105 |
| Hot | September | 6 | - | 42 | 35 | 12 |
| Hot | October | 7 | 1 | 51 | 56 | 7 |
| Cold | November | 11 | - | 174 | 60 | 161 |
| Cold | December | 24 | 3 | 217 | 175 | 143 |
| Cold | January | 26 | 1 | 165 | 19 | 162 |
| Cold | March | 2 | 1 | 40 | 0 | 40 |
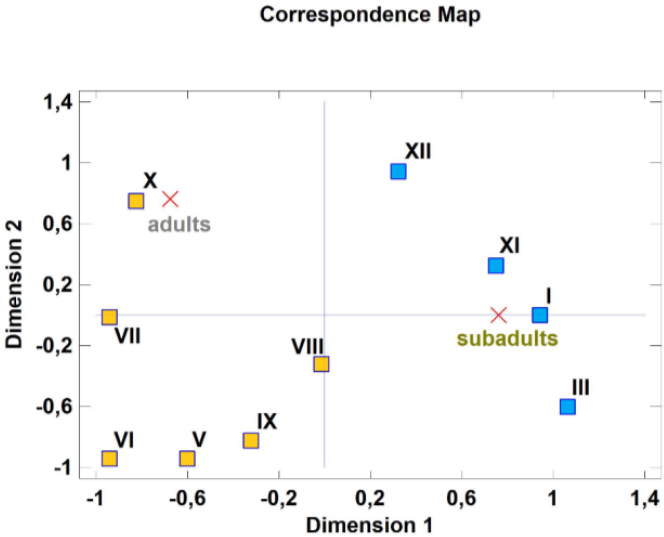
Fig. 1.
Connection between the period of the year and the increased occurrence of adults and/or subadults of Ashworthius sidemi in the abomasa of infected cervid hosts (symmetric map of the correspondence analysis). Red crosses – type of specimens; yellow squares – months from the warm period of the year (V – May, VI – June, VII – July, VIII – August, IX – September and X – October); blue squares – months from the cold period of the year (I – January, III – March, XI – November and XII – December
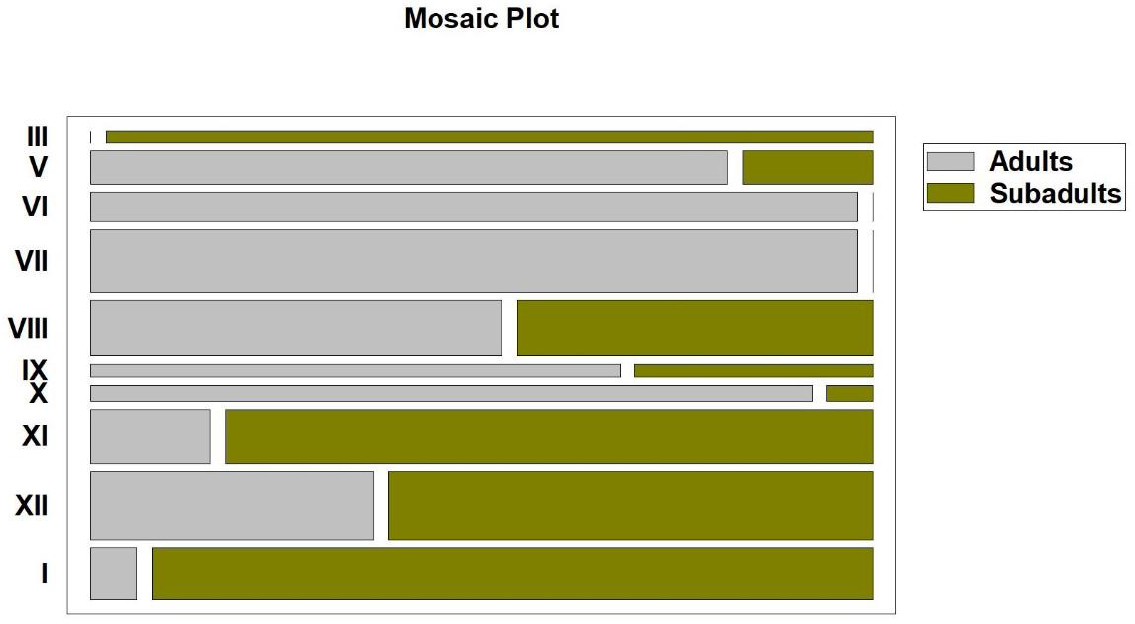
Fig. 2.
Relationships between the particular month and proportions of adults and of subadults of Ashworthius sidemi in the abomasa of infected cervid hosts. Length of the rectangles corresponds to the strength of the correlation; width corresponds to the number of observations. III – March; V – May; VI – June; VII – July; VIII – August; IX – September; X – October; XI – November; XII – December; I – January