
Fig. 1.
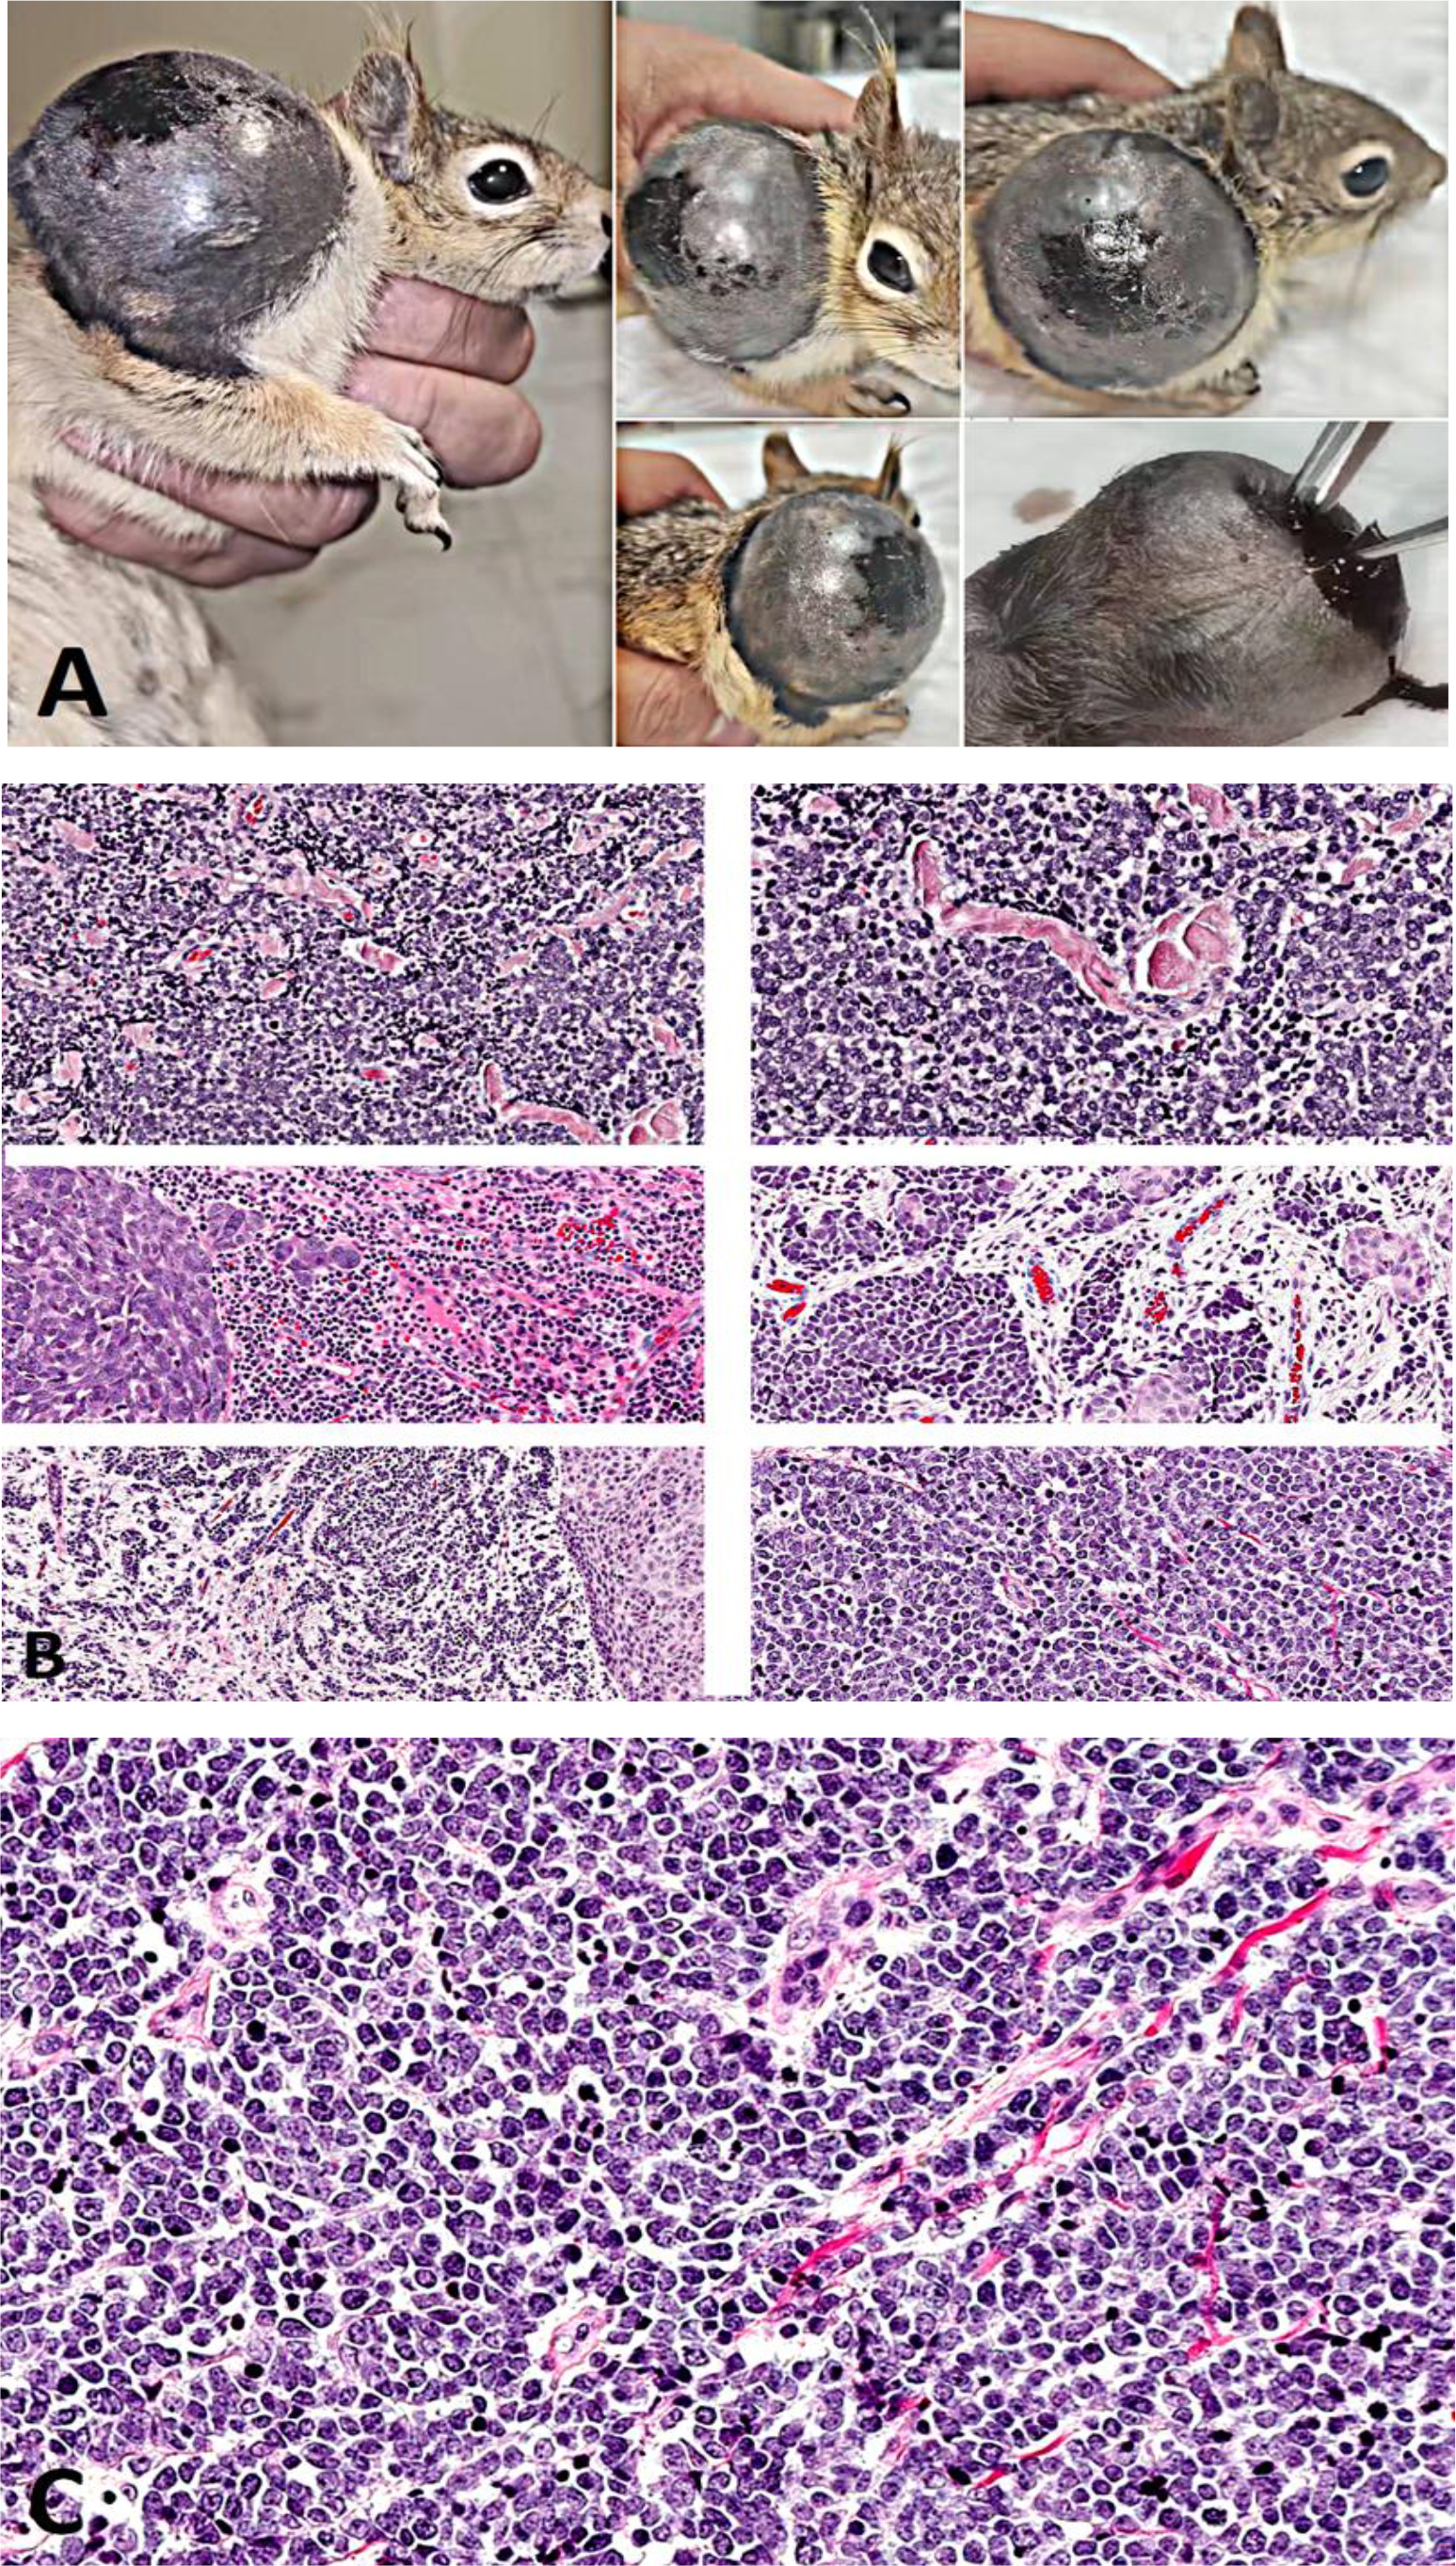
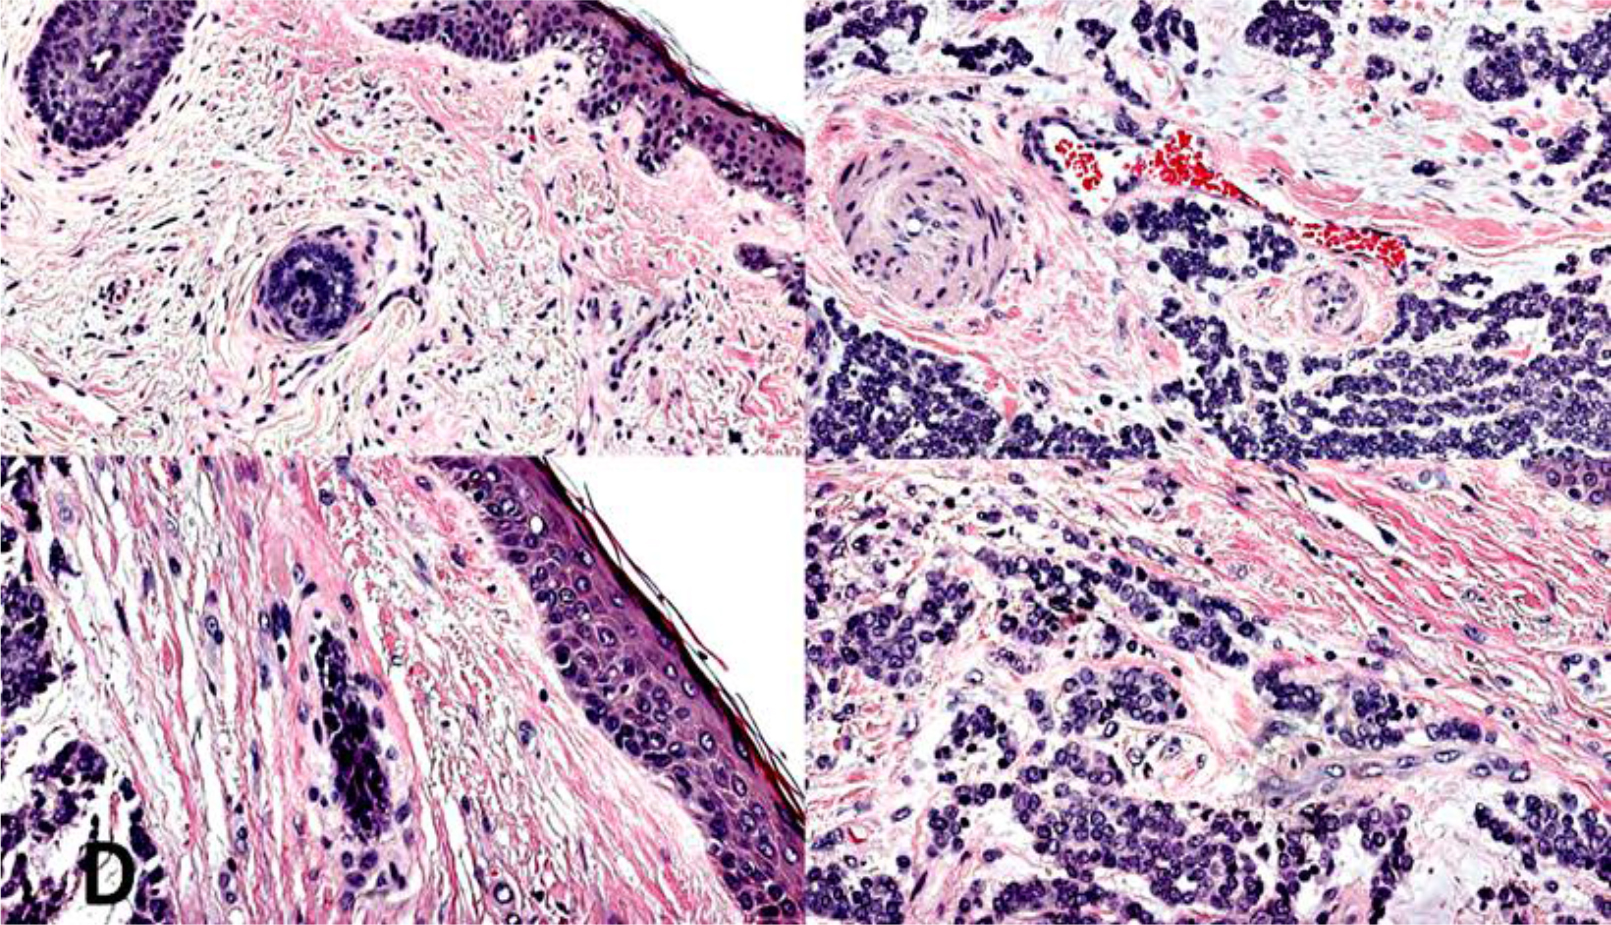
Gross and histopathological features of spontaneous Merkel cell carcinoma in Sciurus anomalus pallescens. (A) Gross appearance of the excised lesion showing a firm, dome-shaped dermal nodule with pale tan surface and multifocal haemorrhagic foci. (B) Histopathological examination of the tumour showing solid sheets and trabeculae of monomorphic small round-to-oval cells with scant cytoplasm and hyperchromatic nuclei (HE). (C) Mitotic count of the tumour showing mitotic figures indicative of high proliferative activity (HE). (D) Lymphovascular invasion in multiple foci, with tumour emboli enclosed by an intact endothelial lining, fulfilling Veterinary Cancer Guidelines and Protocols diagnostic criteria (HE)
Table 1.
Quantitative morphometric analysis of the Merkel cell carcinoma in Sciurus anomalus pallescens
| Parameter | Methodology / quantification approach | Measured value (mean ± SD) | Interpretation / diagnostic significance |
|---|---|---|---|
| Total tumour area (mm2) | Digital planimetry; threshold-based segmentation of tumour parenchyma vs. stroma | 12.86 ± 0.41 | Defines baseline morpho-metric field for necrosis and mitotic density assessment |
| Necrotic area (% of tumour parenchyma) | Morphometric segmentation of necrotic zones (eosinophilic debris, nuclear karyorrhexis and ghost cell outlines) relative to viable tumour tissue | 18.2 ± 1.3% | Consistent with extensive ischaemic necrosis typical of high grade neuroendocrine carcinomas |
| Mitotic count (per 2.37 mm2) | Enumerated manually under 400× magnification (field number 22 mm ocular) across 10 contiguous high-power fields | 52 | Reflects markedly elevated proliferative index, supporting Grade III malignancy |
| Ki-67 labelling index (% of tumour nuclei) | Immunohistochemical quantification using QuPath v. 0.4.3 (n = 2,500 cells and threshold ≥ 1% nuclear staining) following established digital image analysis guidelines for Ki-67 assessment in neuroendocrine tumours (3) | 68.1 ± 2.4% | Indicates extreme proliferative activity and high cellular turnover rate |
| Lymphovascular invasion | Identified morphologically and verified via CD31 immunostaining; strict Veterinary Cancer Guidelines and Principles criteria applied | Present (3 foci / section) | Confirms intraluminal tumour emboli with intact endothelial lining; predictor of metastasis |
| Tumour-stroma ratio | Ratio of tumour cellularity to stromal area (imaging mass cytometry segmentation, single-cell annotation and 1,000-μm2 regions of interest) | 3.4:1 | Demonstrates high tumour cell density and limited stromal buffering capacity |
| Mean nuclear diameter (μm) | Quantified on HE images (n = 200 cells) using HALO CytoNuclear module | 8.3 ± 0.6 | Reflects monomorphic small-cell morphology characteristic of MCC |
| Tumour necrosis index | Composite score = (necrotic area × mitotic count) / total viable tumour area | 0.73 ± 0.04 | Quantitative index correlating with high-grade neuro-endocrine tumour aggressiveness |
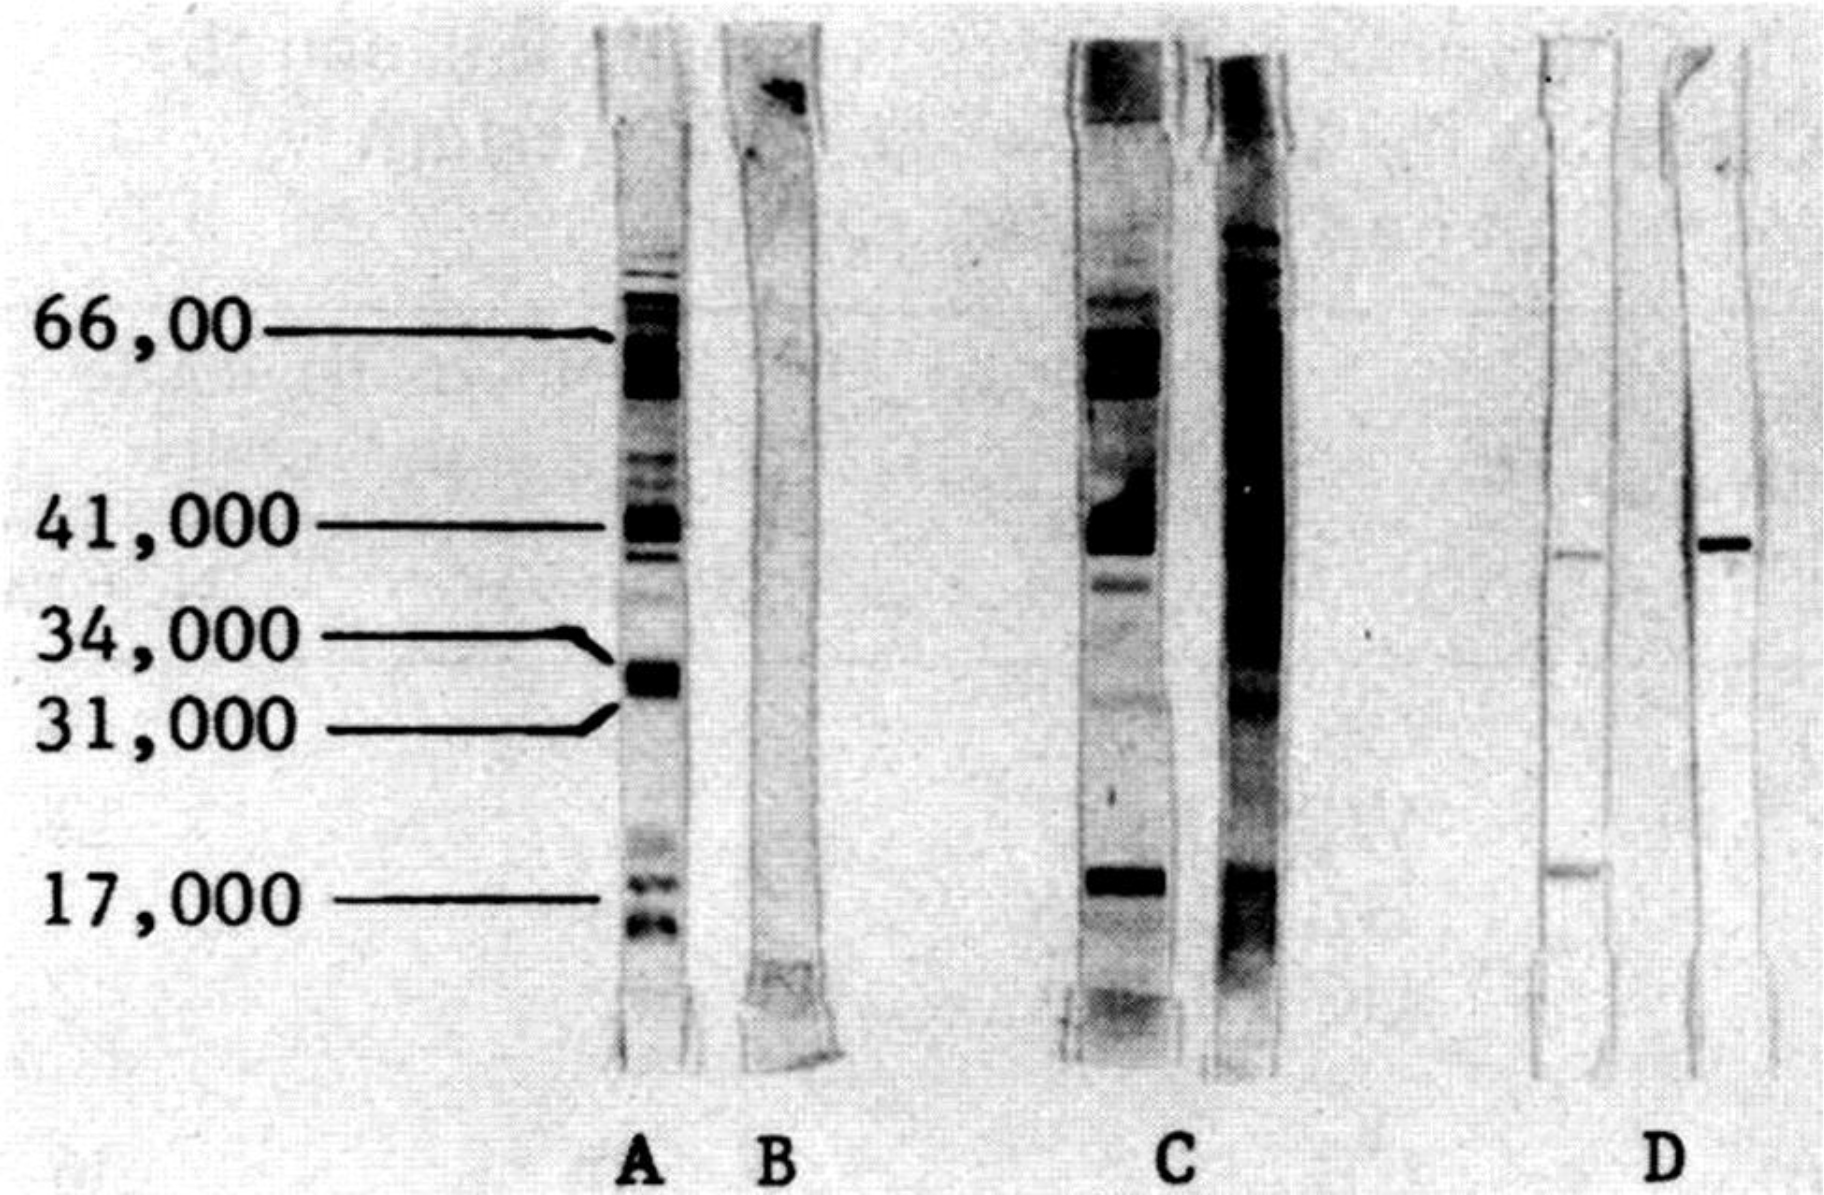
Fig. 2.
Western blot validation of antibody cross-reactivity with Sciurus anomalus antigens. (A) Molecular weight marker (kDa) and human Merkel cell carcinoma (MCC) positive control tissue lysate showing expected bands for cytokeratin 20 (~46 kDa), synaptophysin (~38 kDa), and chromogranin A (~48–55 kDa). (B) Negative control (no primary antibody) confirming absence of non-specific signal. (C) Sciurus anomalus pallescens normal skin lysate demonstrating weak or absent target protein expression, consistent with tissue specificity. (D) Sciurus anomalus pallescens MCC tumour lysate displaying specific bands corresponding to the expected molecular weights observed in the human positive control, confirming antibody cross-reactivity
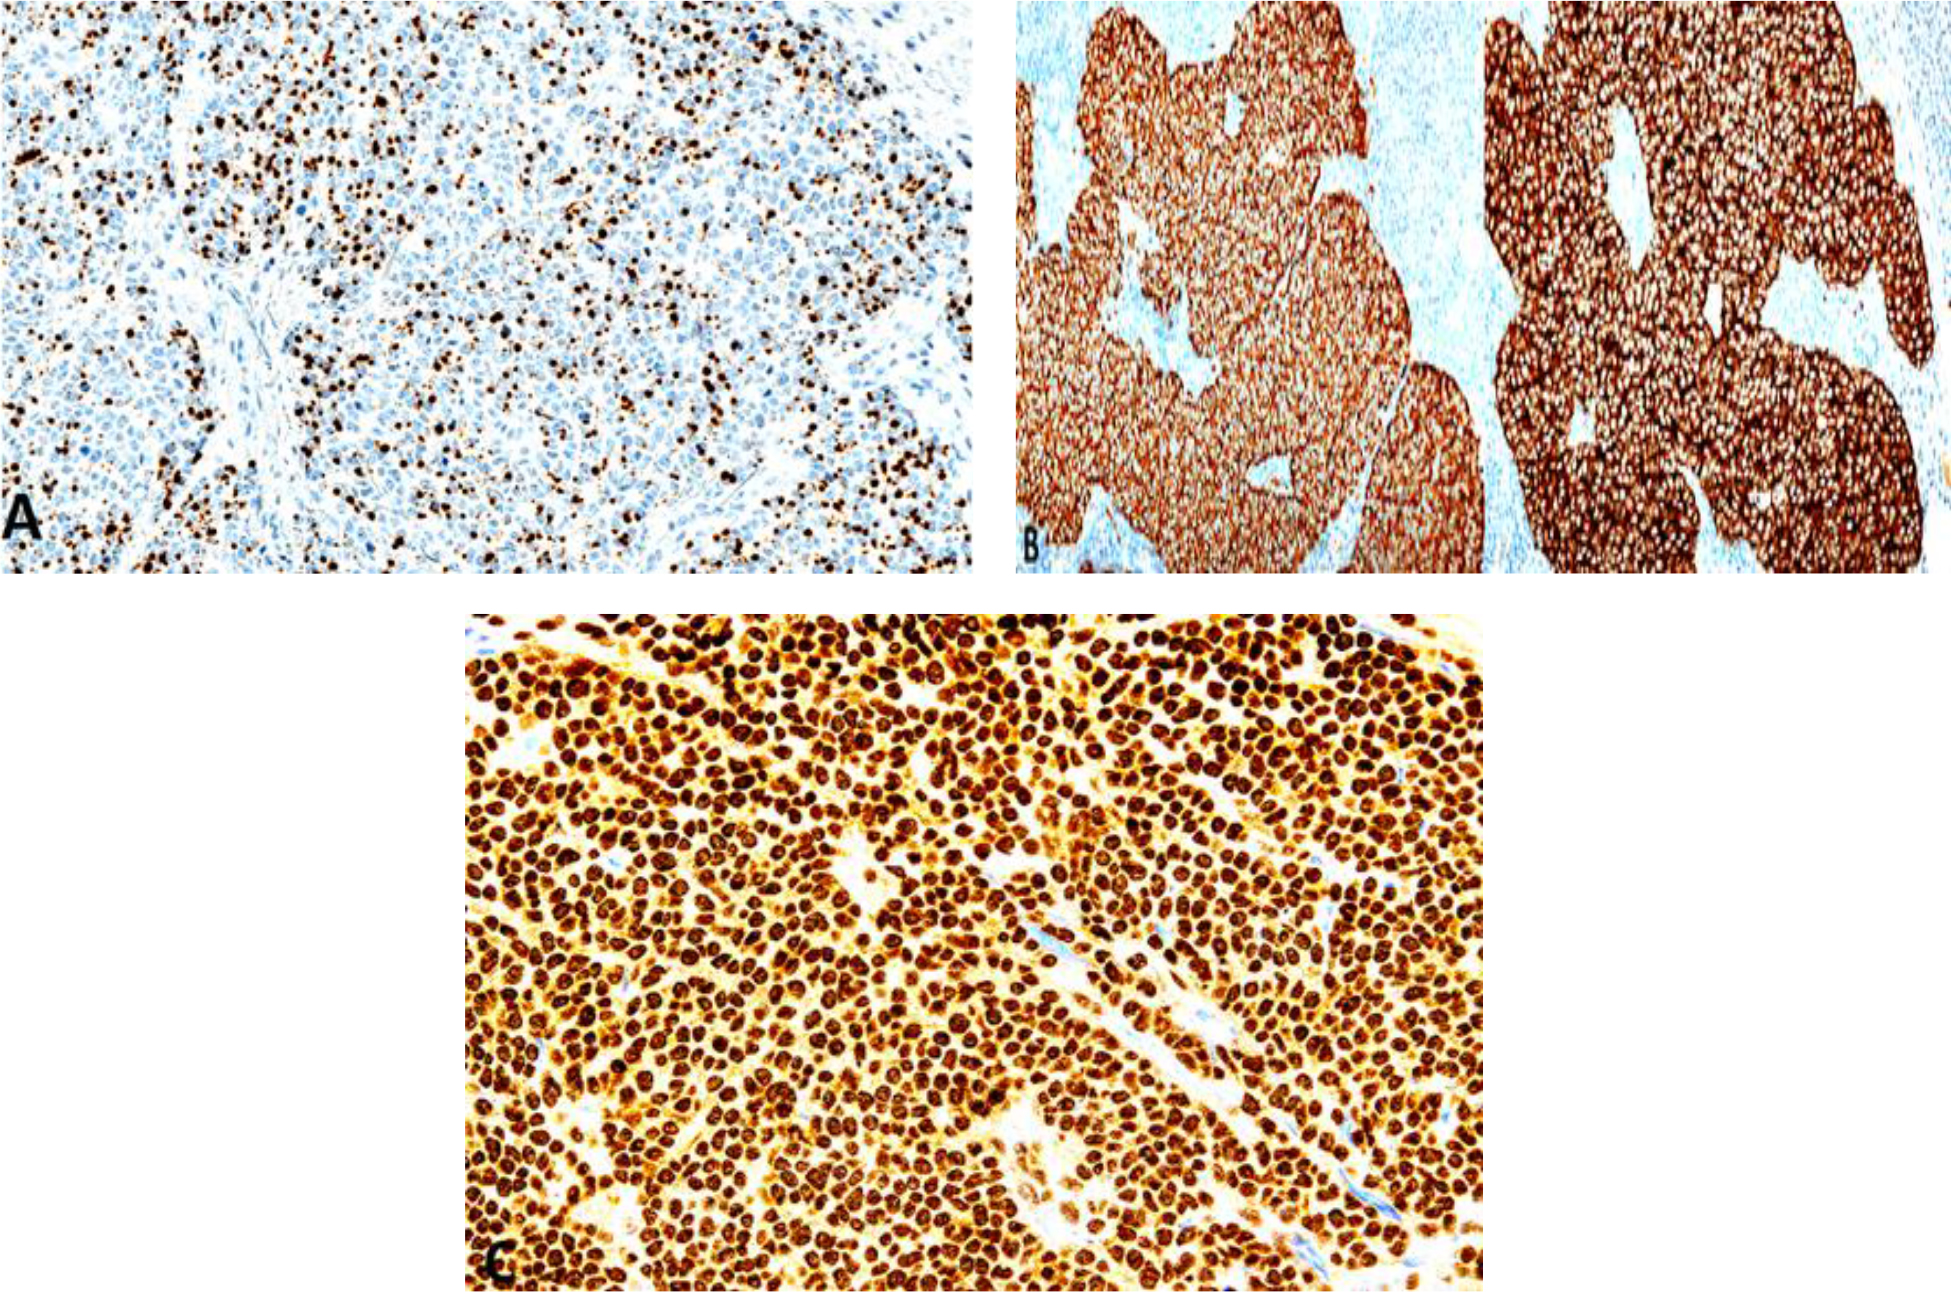
Fig. 3.
Immunohistochemical characterisation of the Merkel cell carcinoma in Sciurus anomalus pallescens. (A) Cytokeratin 20 immunohistochemistry showing characteristic paranuclear dot-like pattern. (B) Robust expression of chromogranin A and synaptophysin, confirming neuroendocrine differentiation. (C) Ki-67 labelling index of 68%, indicating high proliferative activity
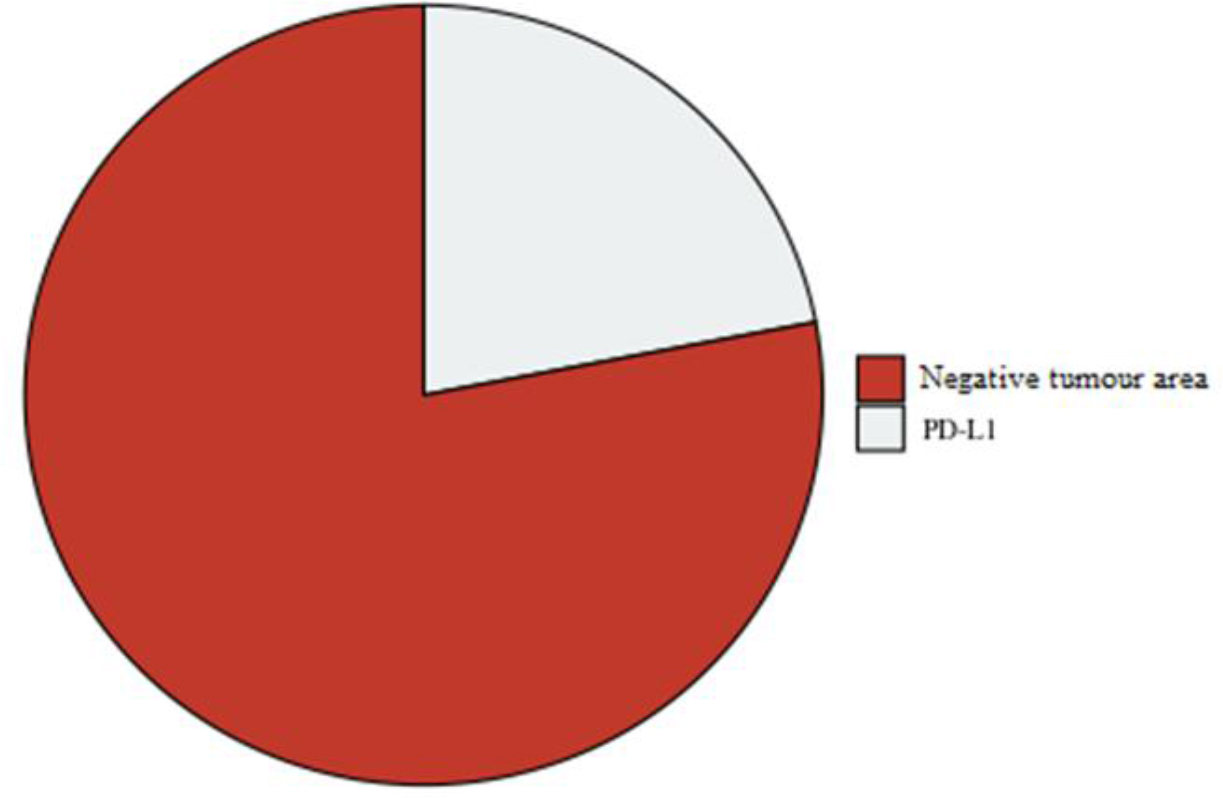
Fig. 4.
Programmed-death ligand 1 (PD-L1) expression detection in neoplastic cells in Sciurus anomalus pallescens, indicative of immune evasion mechanisms
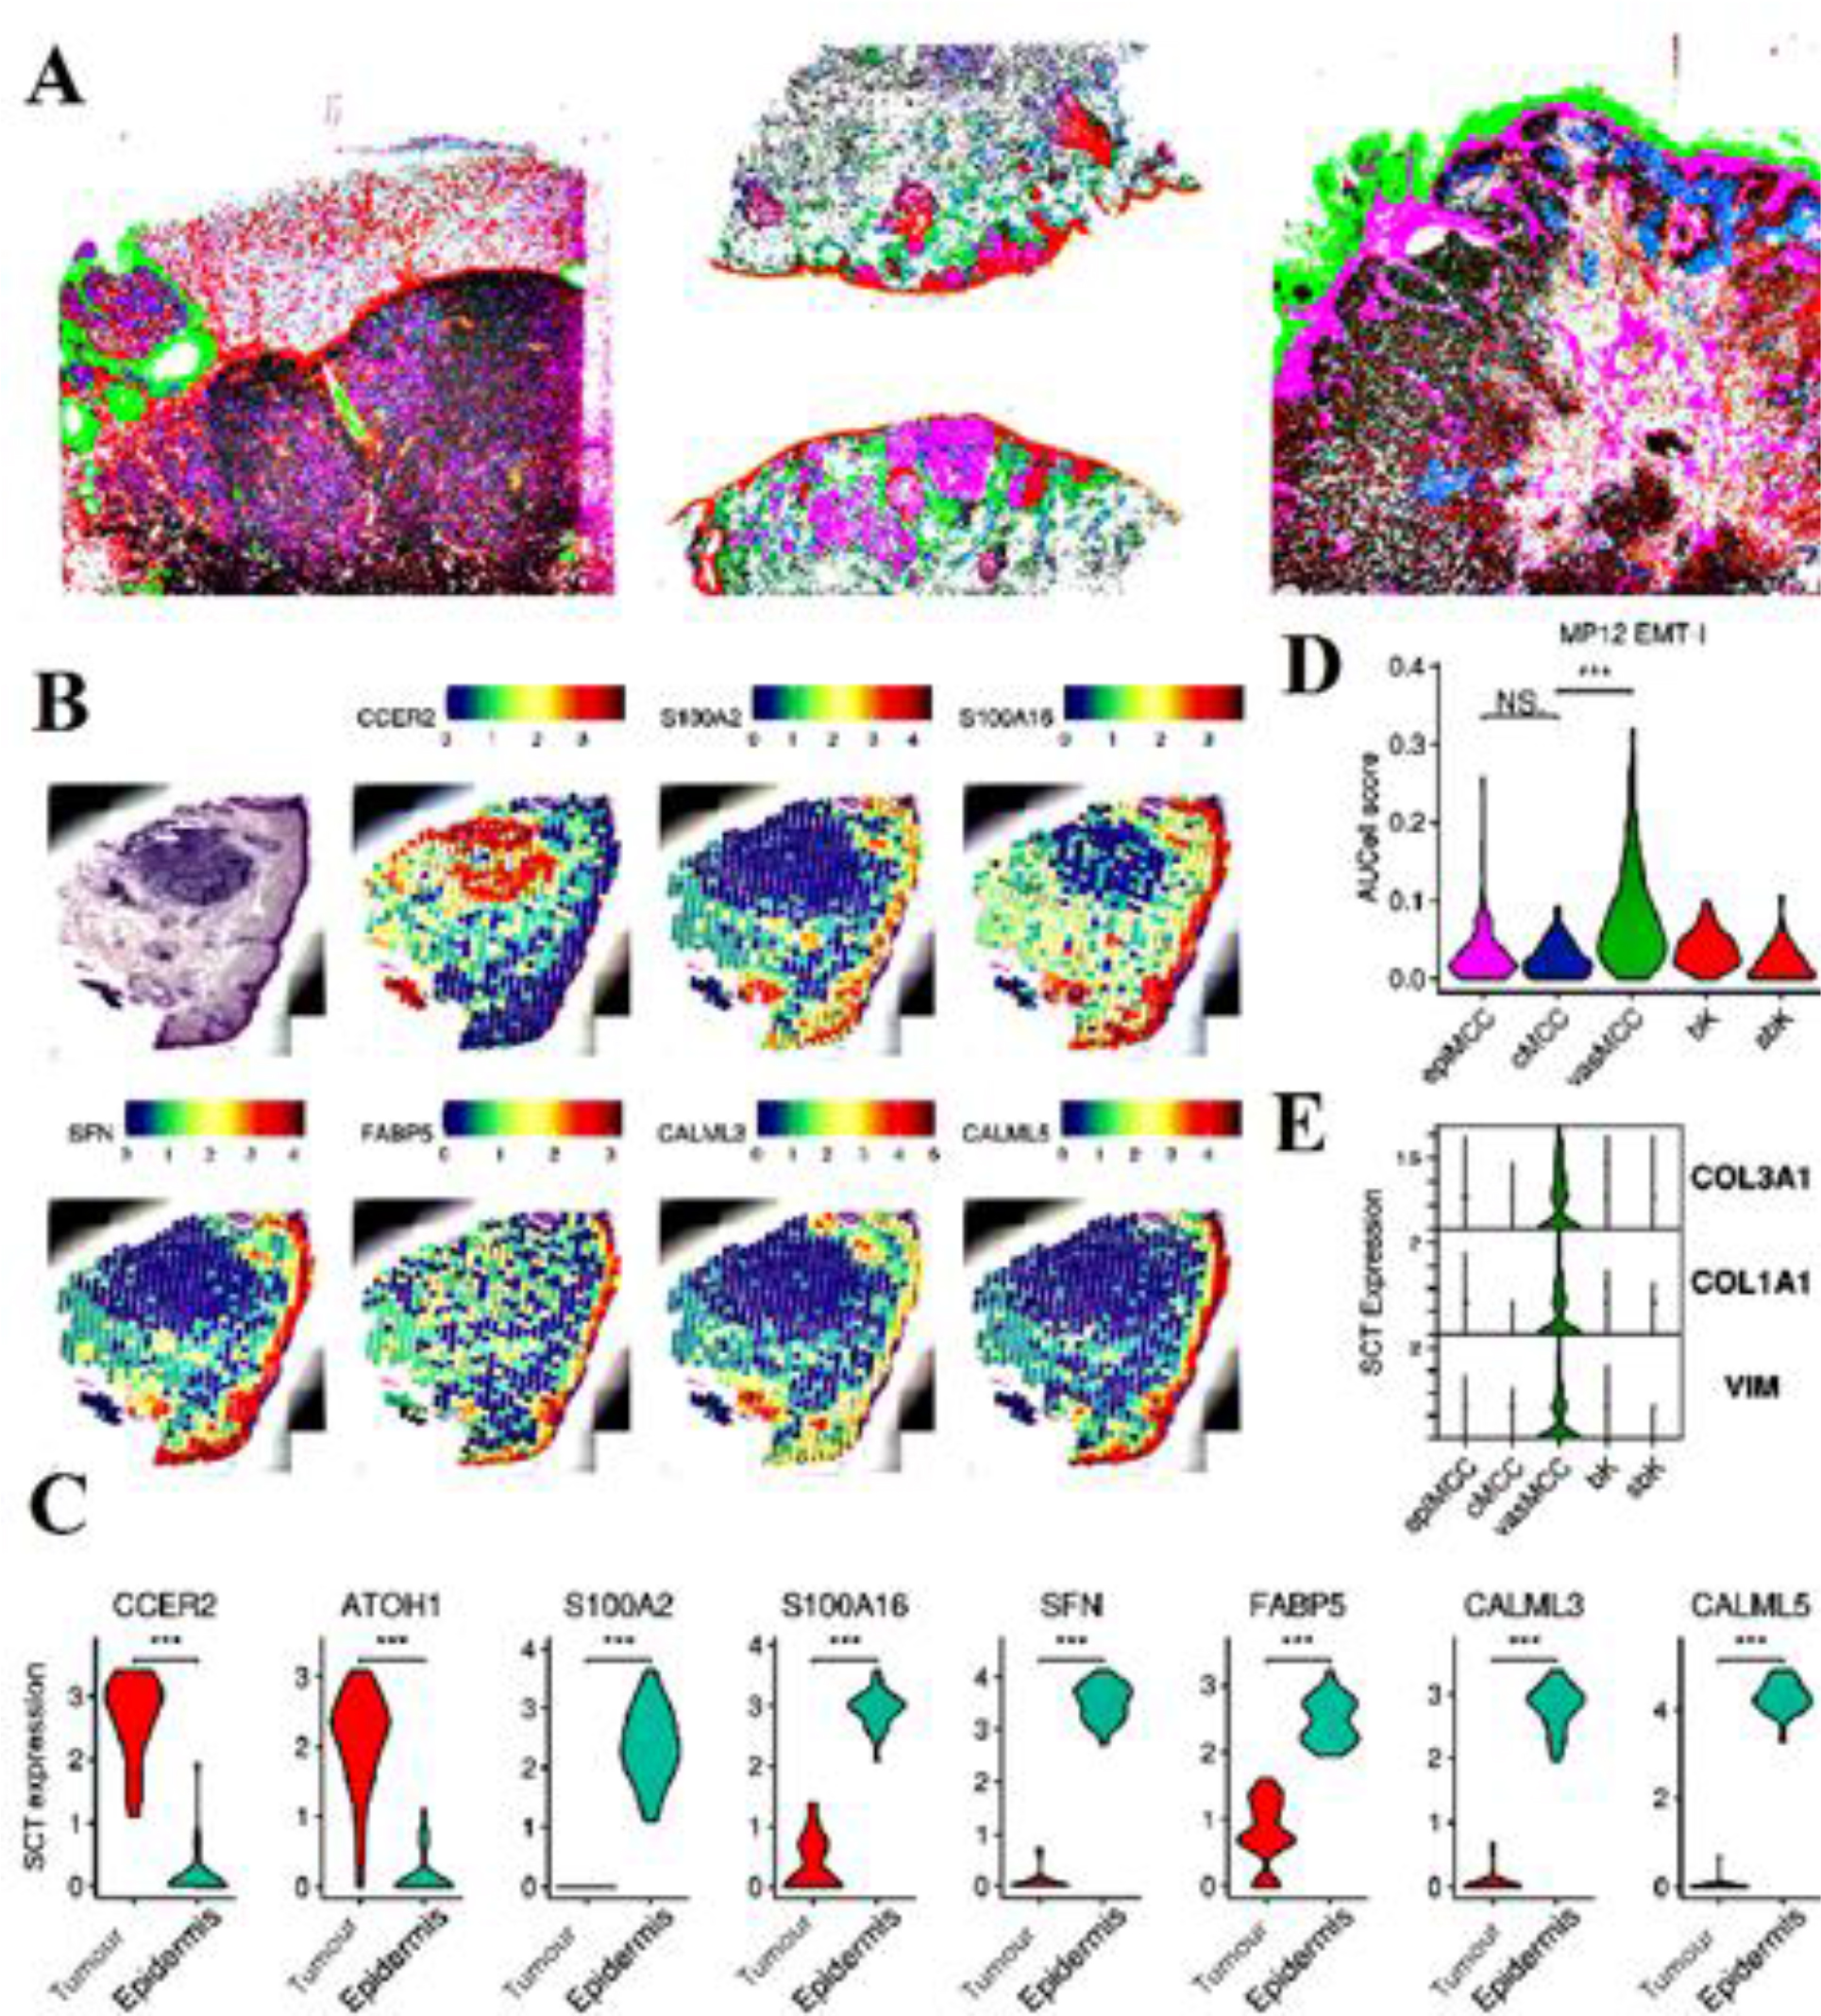
Fig. 5.
Spatial transcriptomic architecture of spontaneous Merkel cell carcinoma (MCC) in Sciurus anomalus pallescens. (A) Spatial transcriptomic profiling delineates discrete molecular clusters within the tumour microenvironment. Colour-coded clusters correspond to histologically distinct regions: magenta denotes tumour core enriched in neuroendocrine lineage genes (atonal basic helix–loop–helix transcription factor (ATOH1), insulinoma-associated protein 1 (INSM1) and sex-determining region Y-box transcription factor 2 (SOX2)); cyan indicates the invasive front with upregulated proliferative and immune checkpoint markers (marker of proliferation Ki-67 (MKI67), CD274 and cytotoxic T-lymphocyte-associated protein 4); yellow represents the peritumoural stromal niche expressing extracellular matrix and macrophage-associated genes (collagen type I alpha 1 chain (COL1A1), CD68 and C-X-C motif chemokine ligand 12 (CXCL12)). (B) HE reference image of the corresponding tissue section with matched spatial grid overlay. (C) Spatially resolved expression of neuroendocrine lineage markers (ATOH1, SOX2 and INSM1) defining the highly cellular tumour core. (D) Expression of proliferative and immune checkpoint genes (MKI67 and CD274) highlighting the invasive front and immune-modulated peripheral tumour zone. (E) Stromal compartment enriched for extracellular matrix and immune regulatory genes (COL1A1, CD68 and CXCL12), delineating the supportive peritumoural microenvironment. MP12 EMT-I – module-panel 12 epithelial–mesenchymal transition index; NS – not significant; VIM – vimentin; CCER2 – coiled-coil glutamate-rich protein 2; S100A2/16 – S100 calcium-binding protein A2/A16; SFN – stratifin; FAPB5 – fatty acid binding protein 5; CALML3/5 – calmodulin-like 3/5; SCT – secretin; COL3A1 – collagen type III alpha 1 chain; epiMCC – epithelial MCC cluster; cMCC – classic MCC cluster; vasMCC – vascular MCC cluster; bk – background tissue cluster; sbk – sub-background tissue cluster; Data are visualised as semi-transparent molecular overlays corresponding to tumour (magenta), invasive front (cyan) and stromal (yellow) clusters. Scale bar = 1 mm
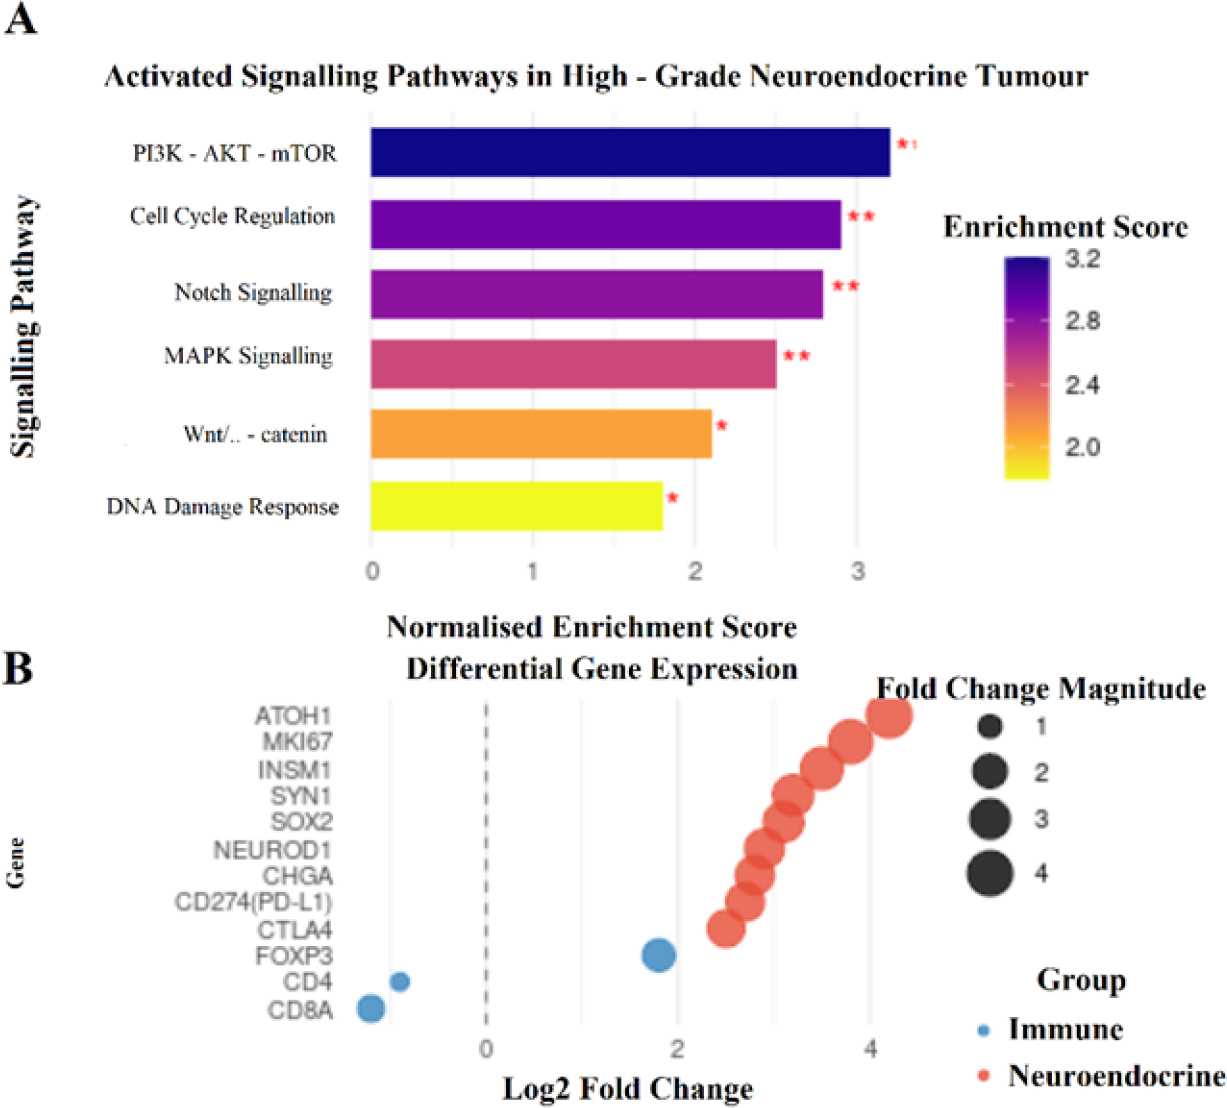
Fig. 6.
Analysis of Sciurus anomalus pallescens tissue for gene-set enrichment highlighting activation of Notch, phosphoinositide 3-kinase–AKT serine/threonine kinase 1–mechanistic target of rapamycin (PI3K-AKT-mTOR) and mitogen-activated protein kinase (MAPK) signalling pathways, consistent with a high-grade neuroendocrine tumour phenotype. Wnt/β-catenin – wingless+int–beta-catenin signalling pathway; ATOH1 – atonal basic helix–loop–helix transcription factor 1; MKI67 – marker of proliferation Ki-67; INSM1 – insulinoma-associated protein 1; SOX2 – sex-determining region Y-box transcription factor 2; NEUROD1 – neurogenic differentiation factor 1; CHGA – chromogranin A; PD-L1 – programmed-death protein 1; CTLA4 – cytotoxic T-lymphocyte-associated protein 4; FOXP3 – forkhead box subfamily P member 3
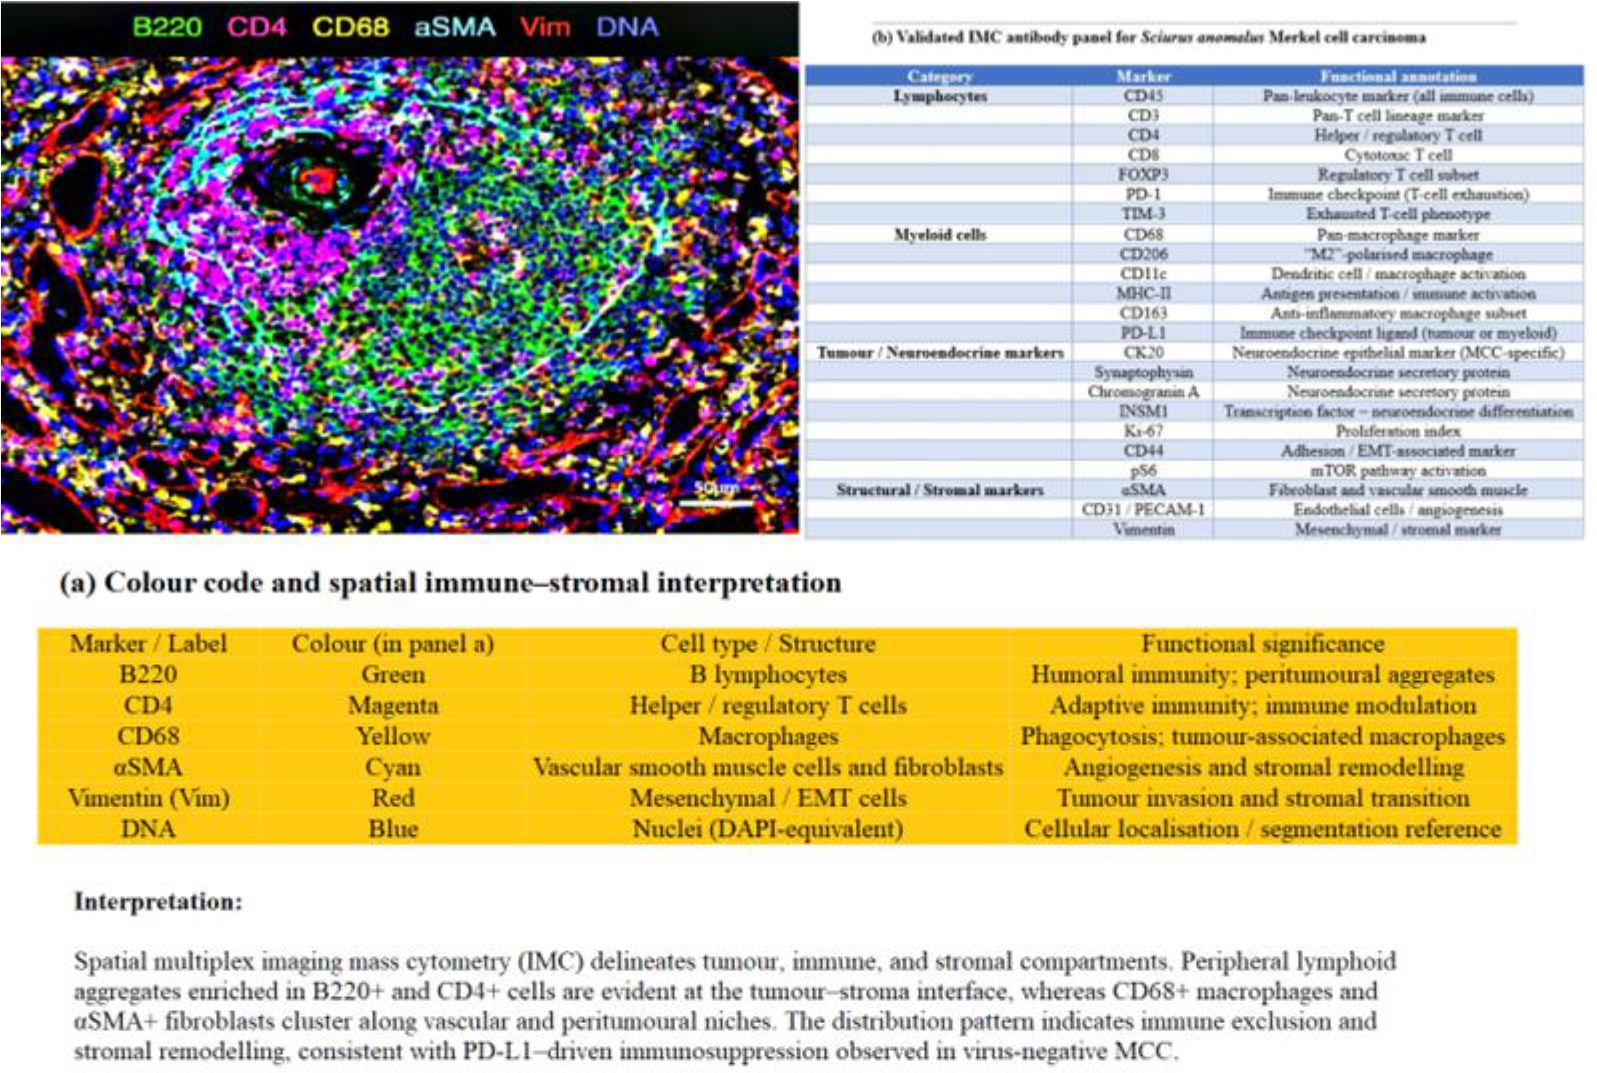
Fig. 7.
Integration of spatial transcriptomic data from Sciurus anomalus pallescens tissue with imaging mass cytometry revealing spatial juxtaposition – but not intratumoural colocalisation – of programmed-death ligand 1 (PD-L1)+ tumour cells and CD8+ lymphocytes, consistent with an immune-excluded phenotype. FOXP3 – forkhead box subfamily P member 3; PD-1 – programmed-death protein 1; TIM-3 – T-cell immunoglobulin and mucin-domain containing protein 3; MHC-II – major histocompatibility complex class II; MCC – Merkel cell carcinoma; INSM1 – insulinoma-associated protein 1; EMT – epithelial–mesenchymal transition; pS6 – phosphorylated ribosomal protein S6; αSMA – alpha smooth-muscle actin; PECAM-1 – platelet endothelial cell adhesion molecule-1; DAPI – 4′,6-diamidino-2-phenylindole
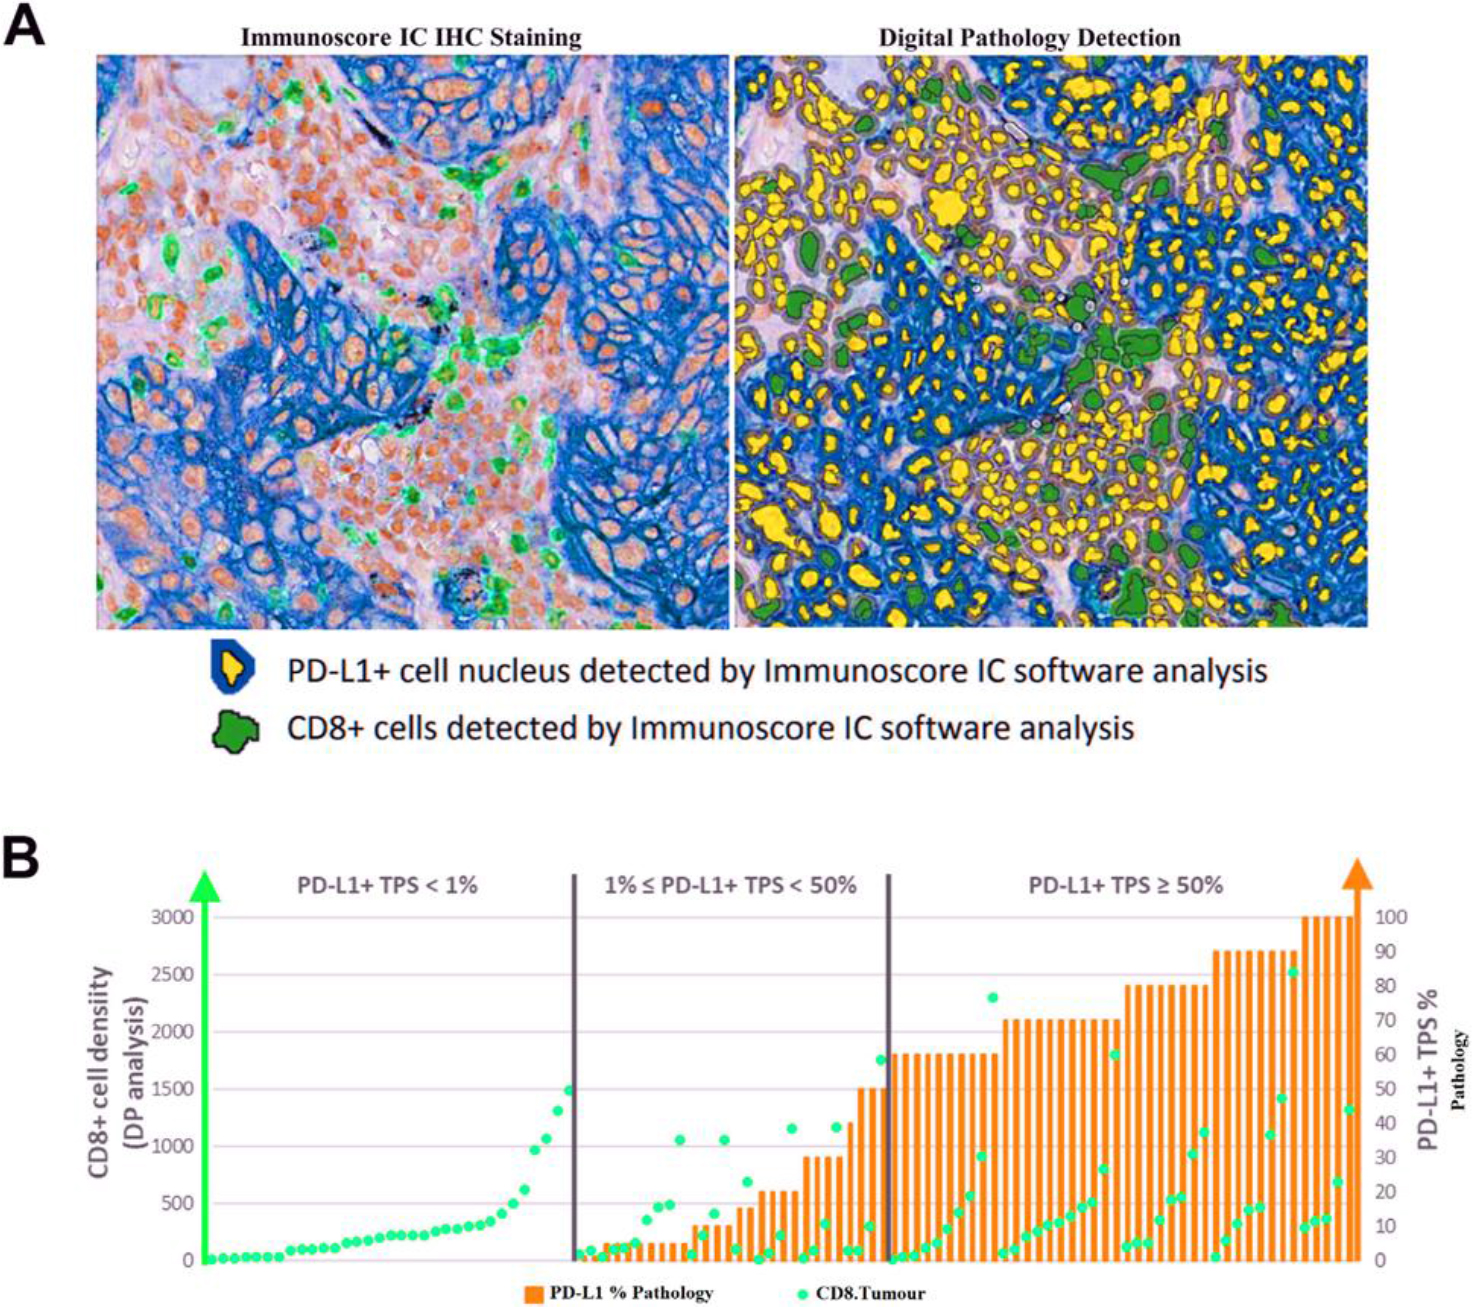
Fig. 8.
Spatial immune architecture and marker composition of spontaneous Merkel cell carcinoma (MCC) in Sciurus anomalus pallescens. (A) Spatial immune and stromal landscape within an MCC lesion showing B cells (B220, green), helper T cells (CD4, magenta), macrophages (CD68, yellow), vascular alpha smooth-muscle actin and fibroblasts (cyan), vimentin-positive mesenchymal cells (red) and nuclei (DNA stain, blue). A peritumoural lymphoid rim and tumour-associated macrophage clustering indicate immune exclusion and stromal remodelling consistent with programmed-death ligand 1 (PD-L1)-driven immune modulation. Scale bar = 50 μm. (B) CD8+ cell density and PD-L1 tumour proportion score (TPS) across cases stratified by PD-L1 expression level. IC – immune checkpoint; IHC – immunohistochemistry; DP – digital pathology
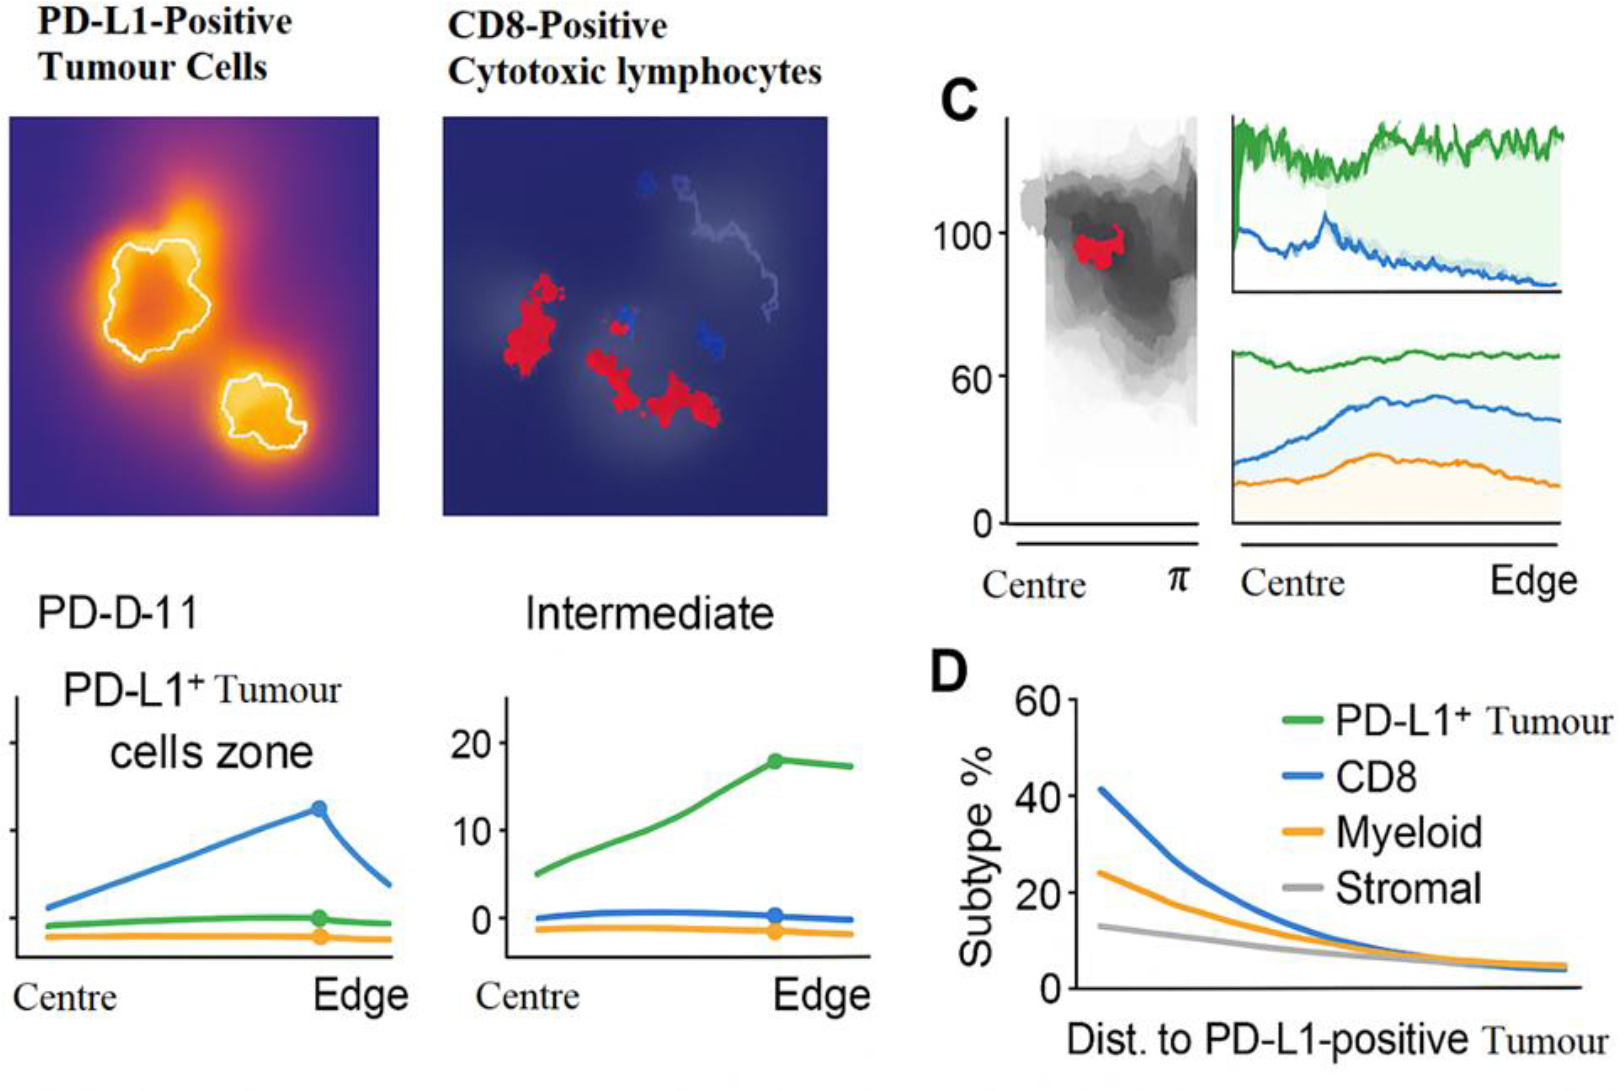
Fig. 9.
Single-cell segmentation and quantitative analysis of imaging mass cytometry data in Sciurus anomalus pallescens Merkel cell carcinoma tissue, showing a tumour to stromal cell ratio of 3.4 : 1, highlighting high cellularity and reduced immune infiltration. Panels C and D represent the spatial distribution of PD-L1-positive tumour cells and CD8-positive cytotoxic lymphocytes relative to the tumour centre and edge. PD-L1 – programmed death ligand 1