
Table 1.
Water parameters (mean ± SD) in the control and experimental groups
| Parameter | Control group | TAM1 | TAM2 |
|---|---|---|---|
| Temp. (°C) | 19.75 ± 0.21 | 19.73 ± 0.22 | 19.70 ± 0.21 |
| O2 (mg/L) | 5.52 ± 0.32 | 5.33 ± 0.42 | 5.24 ± 0.61 |
| pH | 7.31 ± 0.05 | 7.29 ± 0.05 | 7.31 ± 0.06 |
| NH3 (mg/L) | 0.02 ± 0.01 | 0.02 ± 0.01 | 0.01 ± 0.01 |
| NO2− (mg/L) | 0.11 ± 0.15 | 0.09 ± 0.13 | 0.07 ± 0.08 |
| NO3− (mg/L) | 12.41 ± 5.45 | 10.69 ± 5.30 | 9.83 ± 5.65 |
| GH (dGH) | 5.10 ± 0.31 | 5.14 ± 0.35 | 5.21 ± 0.41 |
| KH (dKH) | 3.00 ± 0.00 | 3.00 ± 0.00 | 3.00 ± 0.00 |
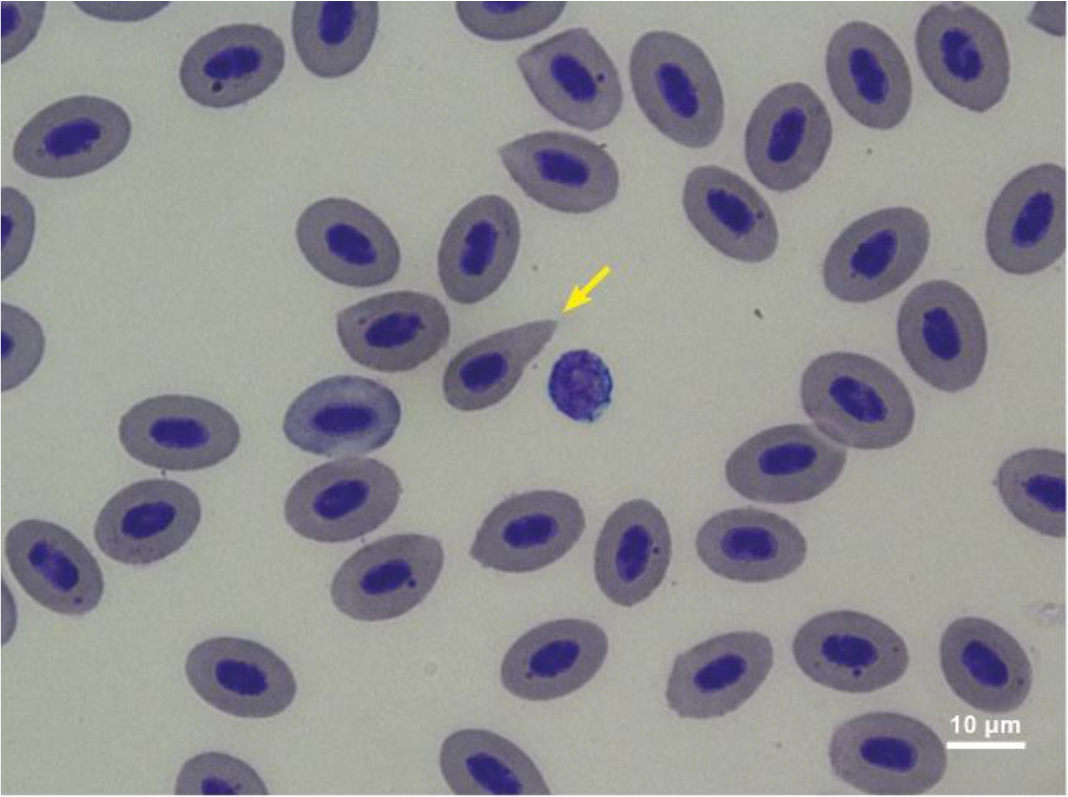
Fig. 1.
Abnormal RBC of common carp intoxicated with Tamizan 040 OD nicosulfuron herbicide for 1 day. Erythrocytes showing changed cell shape
Table 2.
Haematological changes in common carp after 1 day of exposure to Tamizan 040 OD nicosulfuron herbicide
| Parameter | Control group | TAM1 | TAM2 |
|---|---|---|---|
| RBC (106/μL) | 1.53 ± 0.24 | 1.42 ± 0.17 | 1.71 ± 0.24 |
| HCT (%) | 27.54 ± 2.22 | 25.90 ± 1.31 | 29.33 ± 2.49 |
| HGB (g/dL) | 6.90 ± 0.64 | 6.64 ± 0.62 | 7.36 ± 0.79 |
| MCV (fL) | 184.14 ± 32.93 | 186.04 ± 28.98 | 174.85 ± 26.50 |
| MCH (pg) | 45.93 ± 7.34 | 47.76 ± 8.94 | 43.90 ± 7.12 |
| MCHC (g/dL) | 25.07 ± 1.82 | 25.61 ± 1.72 | 25.11 ± 1.74 |
| MNE (%) | 98.06 ± 1.19 | 97.69 ± 1.33 | 95.44 ± 3.19 |
| EAS (%) | 0.17 ± 0.27 | 0.14 ± 0.22 | 0.78 ± 0.69* |
| EAN (%) | 0.14 ± 0.22 | 0.36 ± 0.44 | 0.19 ± 0.17 |
| HE (%) | 0.33 ± 0.40 | 0.67 ± 0.70 | 1.58 ± 1.88 |
| EB (%) | 1.31 ± 1.13 | 1.14 ± 0.92 | 2.00 ± 2.09 |
| WBC (103/μL) | 30.63 ± 7.52 | 26.04 ± 4.87 | 27.69 ± 9.52 |
| LYM (%) | 95.33 ± 4.38 | 93.92 ± 3.58 | 96.33 ± 2.77 |
| Seg (%) | 1.67 ± 2.74 | 2.92 ± 2.11 | 1.83 ± 1.80 |
| ImNeu (%) | 2.58 ± 2.35 | 2.83 ± 1.95 | 1.75 ± 1.29 |
| Mono (%) | 0.42 ± 0.51 | 0.33 ± 0.49 | 0.08 ± 0.29 |
1 TAM1 – group intoxicated with Tamizan 040 OD nicosulfuron herbicide at 1 mg/L of the active substance; TAM2 – group intoxicated with the herbicide at 5 mg/L of the active substance;
Table 3.
Haematological changes in common carp after 3 days of exposure to Tamizan 040 OD nicosulfuron herbicide
| Parameter | Control group | TAM1 | TAM2 |
|---|---|---|---|
| RBC (106/μL) | 1.08 ± 0.10 | 1.17 ± 0.18 | 1.21 ± 0.20 |
| HCT (%) | 26.00 ± 1.78 | 27.46 ± 1.84 | 25.96 ± 2.38 |
| HGB (g/dL) | 7.03 ± 0.66 | 7.18 ± 0.41 | 6.69 ± 0.76 |
| MCV (fL) | 243.02 ± 27.93 | 239.04 ± 39.24 | 218.95 ± 30.80 |
| MCH (pg) | 65.56 ± 7.51 | 62.38 ± 9.01 | 56.40 ± 8.61* |
| MCHC (g/dL) | 27.02 ± 1.77 | 26.20 ± 1.38 | 25.78 ± 1.78 |
| MNE (%) | 97.67 ± 1.65 | 97.58 ± 1.46 | 97.08 ± 1.88 |
| EAS (%) | 0.78 ± 0.69 | 0.92 ± 0.81 | 0.81 ± 0.63 |
| EAN (%) | 0.17 ± 0.22 | 0.75 ± 0.75 | 0.94 ± 1.42 |
| HE (%) | 0.69 ± 1.04 | 0.11 ± 0.16 | 0.08 ± 0.21 |
| EB (%) | 0.69 ± 0.85 | 0.64 ± 0.48 | 1.08 ± 1.20 |
| WBC (103/μL) | 25.23 ± 4.81 | 26.04 ± 5.17 | 27.04 ± 3.80 |
| LYM (%) | 94.50 ± 3.90 | 93.67 ± 4.48 | 96.50 ± 1.68 |
| Seg (%) | 2.67 ± 1.78 | 2.25 ± 2.09 | 1.25 ± 1.14 |
| ImNeu (%) | 2.75 ± 2.73 | 4.08 ± 3.15 | 2.25 ± 1.29 |
| Mono (%) | 0.08 ± 0.29 | 0.00 ± 0.00 | 0.00 ± 0.00 |
1 TAM1 – group intoxicated with Tamizan 040 OD nicosulfuron herbicide at 1 mg/L of the active substance; TAM2 – group intoxicated with the herbicide at 5 mg/L of the active substance;
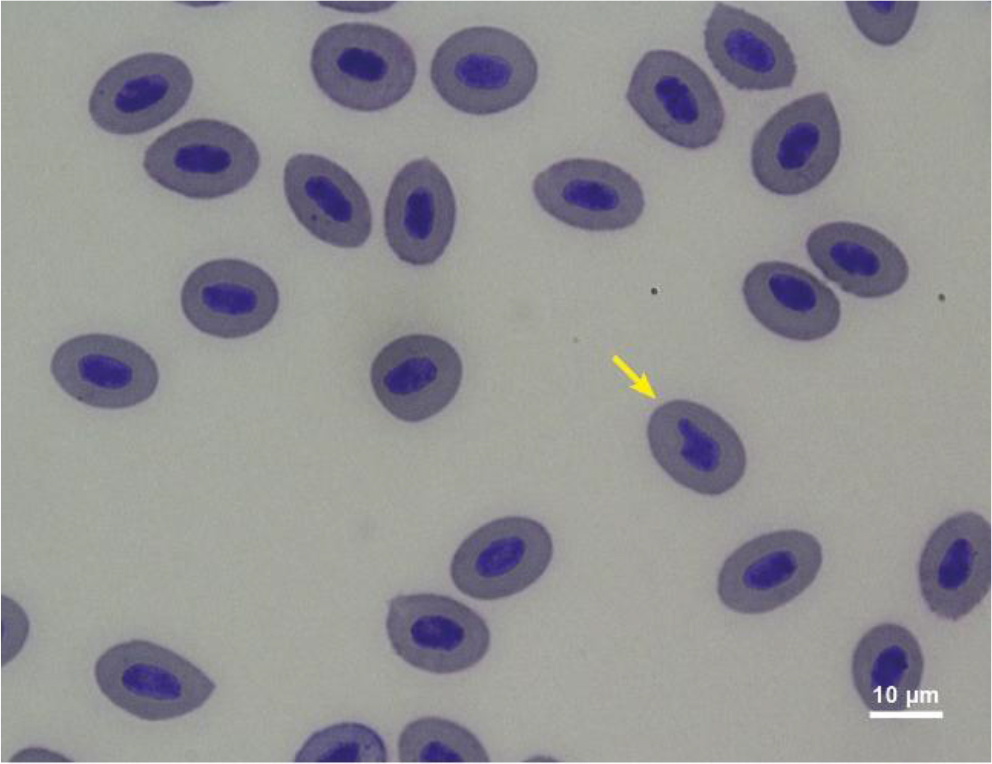
Fig. 2.
Abnormal RBC of common carp intoxicated with Tamizan 040 OD nicosulfuron herbicide for 10 days. Erythrocytes showing changed nucleus shape
Table 4.
Haematological changes in common carp after 10 days of exposure to Tamizan 040 OD nicosulfuron herbicide
| Parameter | Control group | TAM1 | TAM2 |
|---|---|---|---|
| RBC (106/μL) | 1.23 ± 0.23 | 1.29 ± 0.24 | 1.48 ± 0.24* |
| HCT (%) | 26.17 ± 2.25 | 27.38 ± 2.56 | 26.77 ± 2.37 |
| HGB (g/dL) | 6.93 ± 0.48 | 6.97 ± 0.71 | 6.74 ± 0.85 |
| MCV (fL) | 220.74 ± 50.79 | 217.45 ± 39.96 | 183.34 ± 19.72 |
| MCH (pg) | 58.13 ± 11.05 | 55.44 ± 10.83 | 45.99 ± 4.56** |
| MCHC (g/dL) | 26.54 ± 1.37 | 25.51 ± 2.18 | 25.14 ± 1.54 |
| MNE (%) | 96.89 ± 1.44 | 96.17 ± 1.36 | 94.03 ± 2.28** |
| EAS (%) | 1.00 ± 0.86 | 1.36 ± 0.98 | 2.19 ± 1.54 |
| EAN (%) | 0.92 ± 0.89 | 0.47 ± 0.36 | 0.25 ± 0.25* |
| HE (%) | 0.22 ± 0.30 | 0.53 ± 0.61 | 0.72 ± 1.24 |
| EB (%) | 0.97 ± 0.73 | 1.47 ± 0.95 | 2.81 ± 0.97*** |
| WBC (103/μL) | 26.60 ± 6.92 | 22.29 ± 4.68 | 29.40 ± 9.03 |
| LYM (%) | 93.83 ± 3.61 | 93.92 ± 2.31 | 95.25 ± 2.56 |
| Seg (%) | 3.58 ± 2.71 | 2.83 ± 0.94 | 2.58 ± 1.88 |
| ImNeu (%) | 2.50 ± 1.45 | 3.25 ± 2.14 | 2.08 ± 1.56 |
| Mono (%) | 0.08 ± 0.29 | 0.00 ± 0.00 | 0.08 ± 0.29 |
1 TAM1 – group intoxicated with Tamizan 040 OD nicosulfuron herbicide at 1 mg/L of the active substance; TAM2 – group intoxicated with the herbicide at 5 mg/L of the active substance;
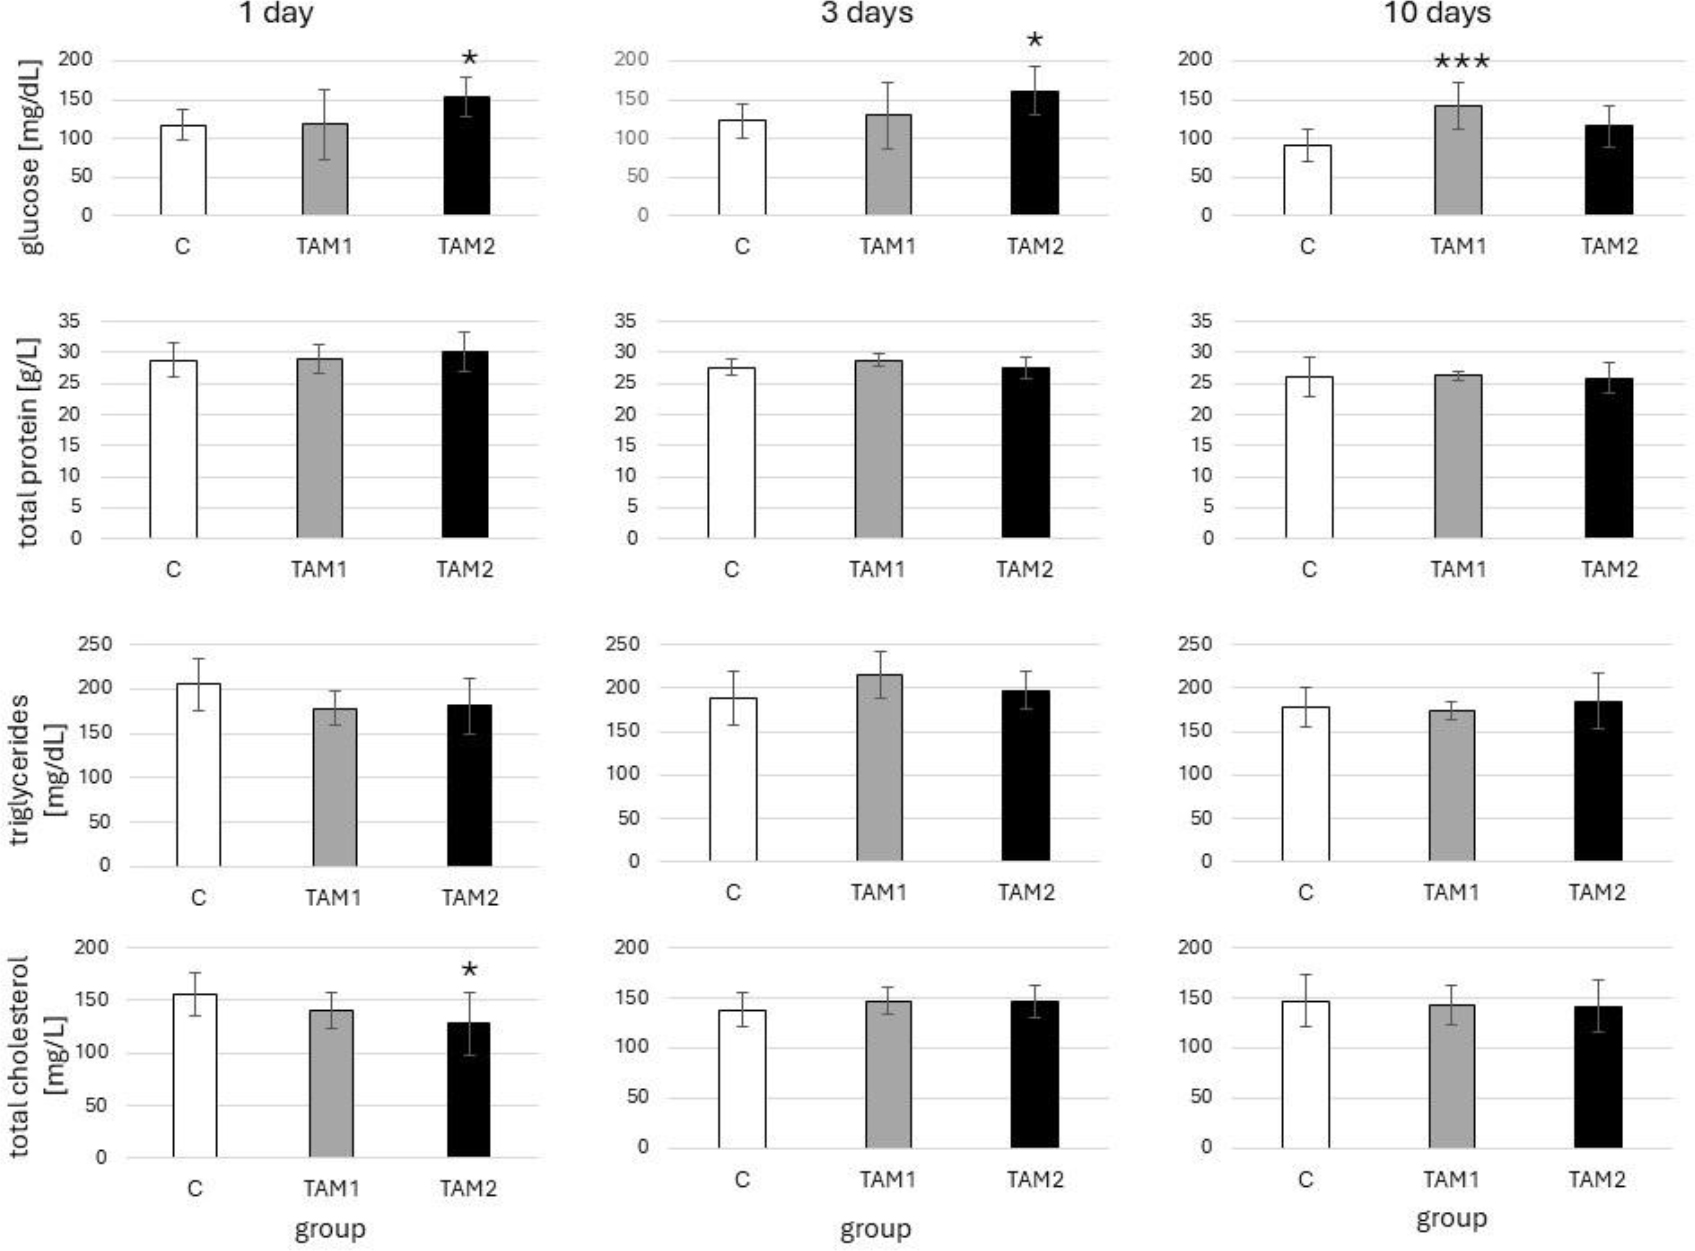
Fig. 3.
Changes in non-enzymatic plasma biochemical parameters of common carp after 1, 3 and 10 days of exposure to Tamizan 040 OD nicosulfuron herbicide. TAM1 – group intoxicated with Tamizan 040 OD nicosulfuron herbicide at 1 mg/L of the active substance; TAM2 – group intoxicated with the herbicide at 5 mg/L of the active substance. Data are presented as means ± SD; significant differences compared to the control values are marked with asterisks; */*** – significant difference from control group value (0.01 ≤ adjusted P-value < 0.05 / 0.000 ≤ adjusted P-value < 0.001)
Table 5.
ALT activity in blood plasma of common carp after 1, 3 and 10 days of exposure to Tamizan 040 OD nicosulfuron herbicide
| Exposure duration | Control group | TAM1 | TAM2 |
|---|---|---|---|
| 1 day | 16.43 ± 4.43 | 18.31 ± 15.63 | 17.55 ± 6.37 |
| 3 days | 10.95 ± 6.56 | 16.44 ± 11.47 | 20.68 ± 10.03 |
| 10 days | 12.07 ± 6.57 | 18.40 ± 12.99 | 11.24 ± 9.46 |
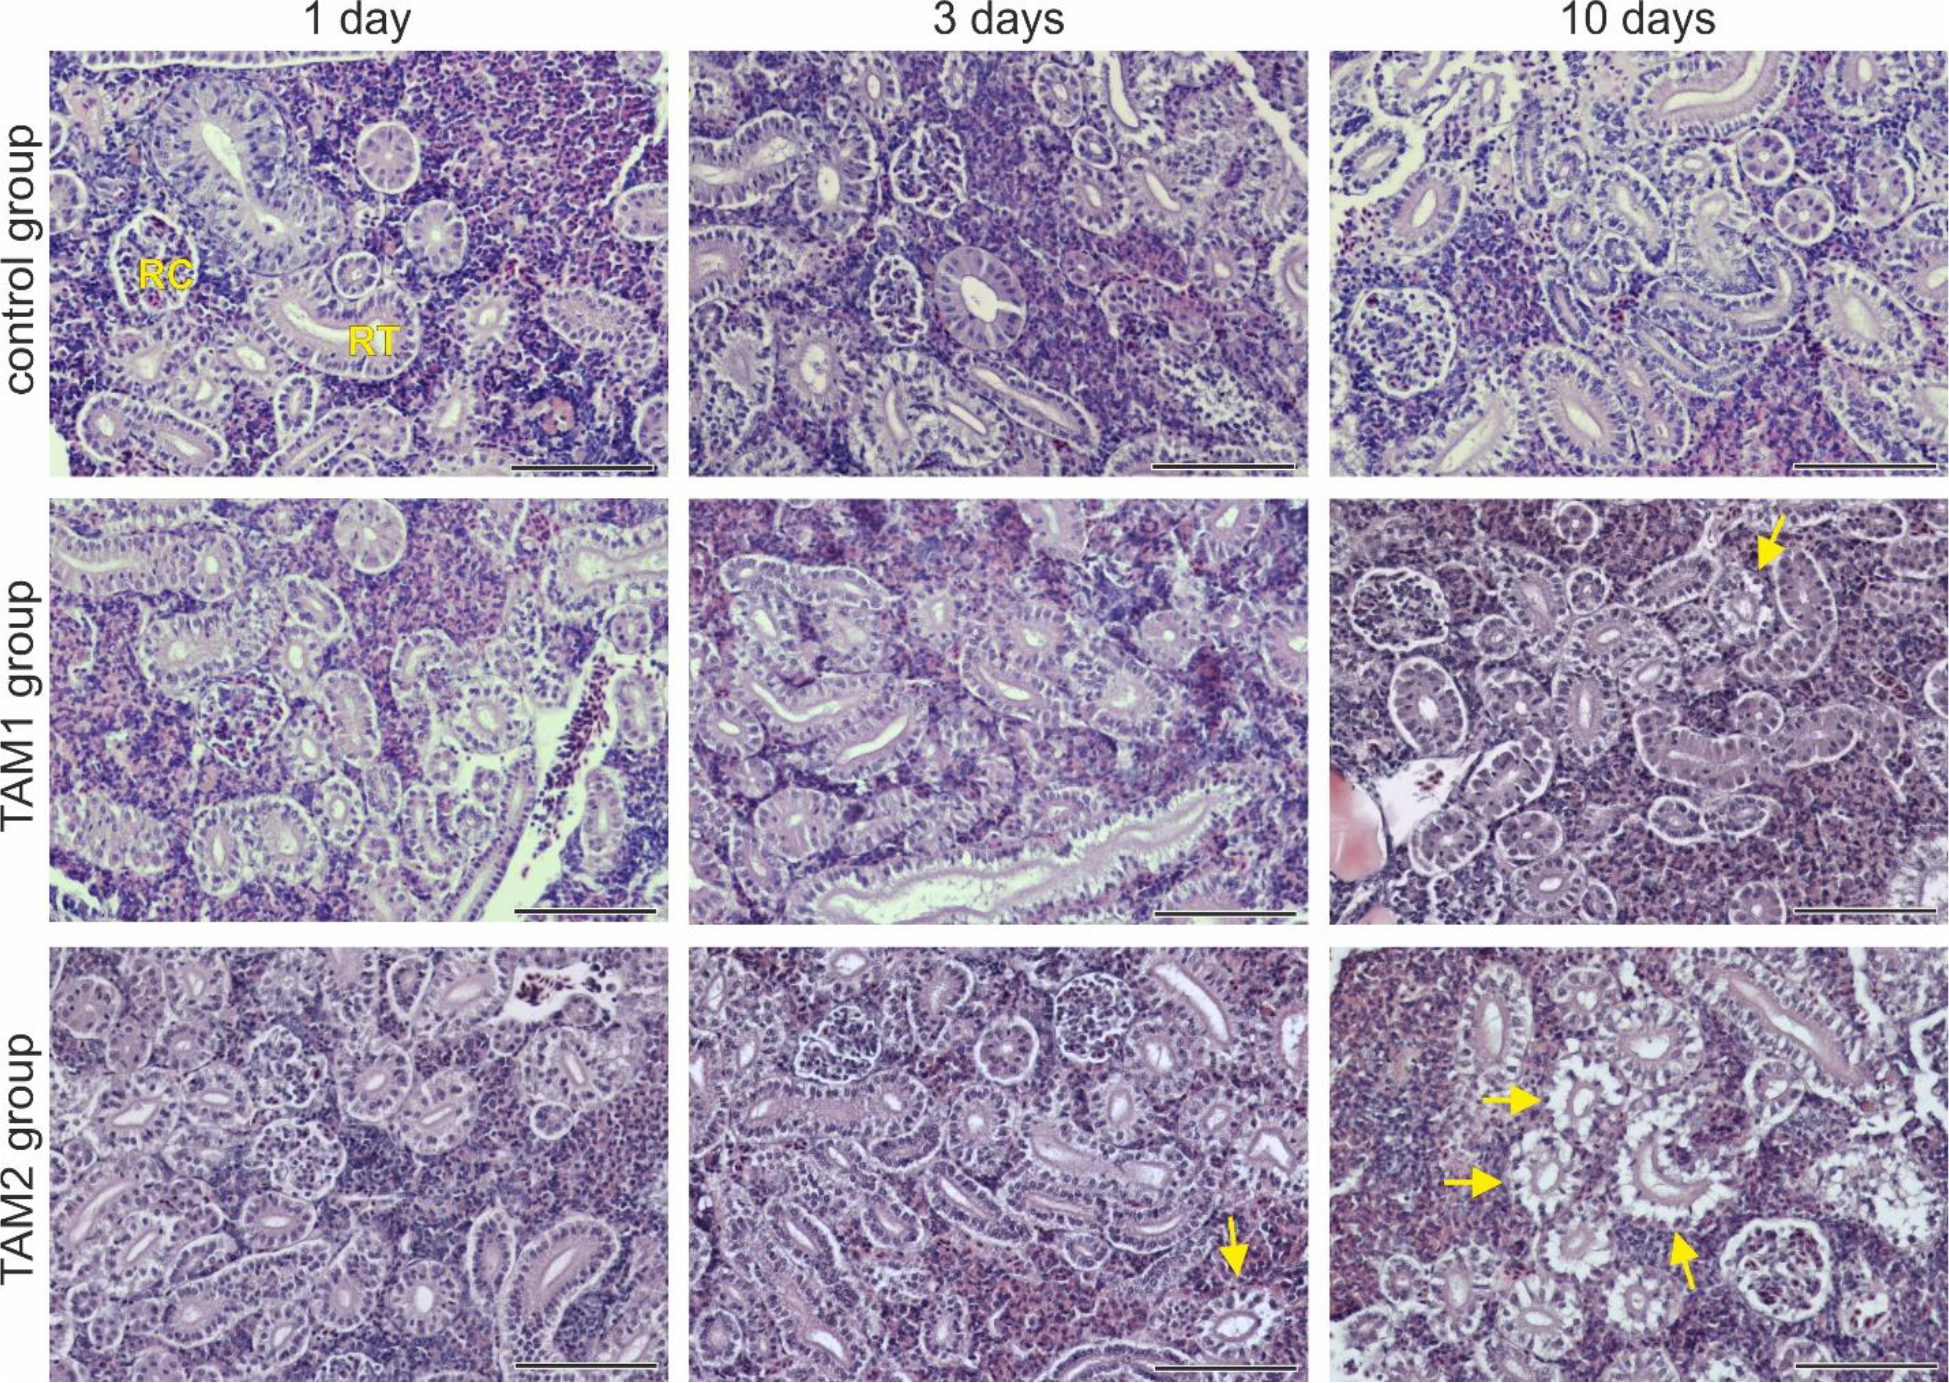
Fig. 4.
Photomicrographs of the trunk kidney of common carp in the control and experimental groups. TAM1 – group intoxicated with Tamizan 040 OD nicosulfuron herbicide at 1 mg/L of the active substance; TAM2 – group intoxicated with the herbicide at 5 mg/L of the active substance; RC – renal corpuscle; RT – renal tubule. Arrows indicate degeneration of renal tubules. Haematoxylin and eosin staining. Scale bars = 100 μm