
Table 1.
Sensitivity of the Flashtest multiplex qPCR assay for p72 (b646L) CD2v (ep402R) and an MGF targets
Table 2.
Paired analysis of threshold cycle (Ct) values for the p72 (b646L) CD2v (ep402R) and an MGF targets, amplified using the Flashtest (Flash) assay in comparison with the Virotype (Viro) qPCR assay
| Target | Median difference in Ct (Flash/Viro) | Wilcoxon p | Spearman rs |
|---|---|---|---|
| p72 | 0.58 | 0.0506 | 0.9522 |
| CD2v | –0.24 | 0.8962 | 0.9633 |
| MGF | –0.54 | 0.6352 | 0.9527 |
Table 3.
Reproducibility parameters Flashtest multiplex qPCR assay
| Target | Range (TCID50/mL) | Mean Ct(±SD) | CV (%) |
|---|---|---|---|
| p72 | High (106) | 20.97 (0.56) | 2.65 |
| Mid (104) | 27.76 (0.54) | 1.96 | |
| Low (103) | 32.02 (1.07) | 3.34 | |
| CD2v | High (106) | 20.09 (0.39) | 1.96 |
| Mid (104) | 26.76 (0.40) | 1.50 | |
| Low (103) | 30.88 (1.02) | 3.30 | |
| MGF | High (106) | 19.96 (0.30) | 1.51 |
| Mid (104) | 26.81 (0.38) | 1.41 | |
| Low (103) | 30.86 (0.82) | 2.67 |
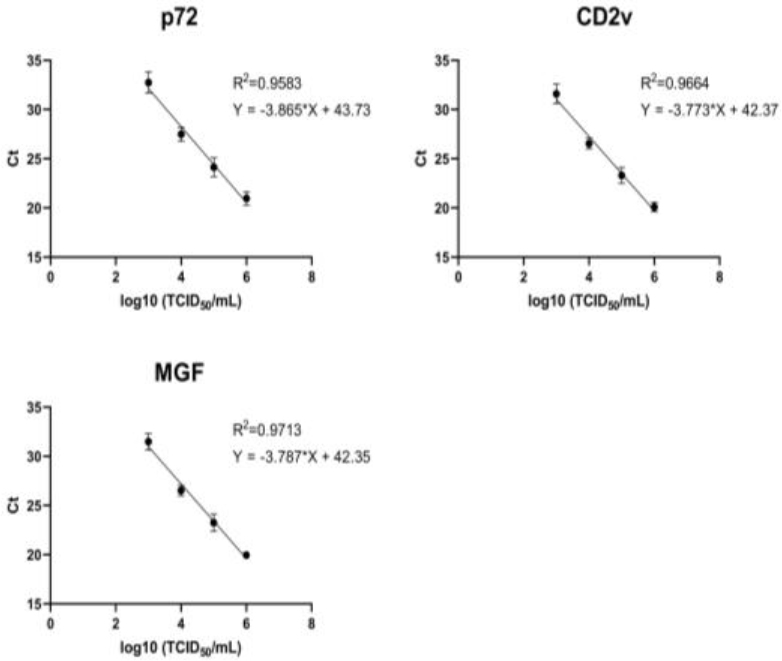
Fig. 1.
Linearity parameters of the Flashtest multiplex qPCR assay. Ct – threshold cycle; TCID50 – 50% tissue culture infective dose. Error bars indicate SD