
Table 1.
Primers used to amplify 1,655 base pairs of the Dicentrarchus labrax lep gene sequence
| Gene region | Primer sequence (5′–3′) | Annealing | Sequenced regions of lep gene of Dicentrarchus labrax | Length |
|---|---|---|---|---|
| Lep-1 | F: GTTGGTTAGAGGGAGCTGT R: ACCATTGTCTCAGCTCACCA | 59°C | Exon 1 and partial region of intron 1 | 849 bp |
| Lep-2 | F: CAGGGGGAGAATGCAAAGT R: CATTCAGTTCAGTTCCCCGT | 61°C | Partial region of intron 1, exon 2, intron 2 and exon 3 | 856 bp |
Table 2.
Descriptive statistics for production traits
| Traits | Min | Max | Mean (SD) | CV (%) |
|---|---|---|---|---|
| TW (g) | 171.05 | 863.60 | 459.35 (156.97) | 34 |
| FW (g) | 81.11 | 417.44 | 243.68 (82.99) | 34 |
| SL (cm) | 21.38 | 36.47 | 29.41 (3.46) | 12 |
| BL (cm) | 15.45 | 27.47 | 21.54 (2.55) | 12 |
| HL (cm) | 5.21 | 18.87 | 8.10 (1.56) | 19 |
| PecAL (cm) | 10.94 | 26.91 | 21.19 (2.92) | 14 |
| AL (cm) | 7.67 | 17.73 | 13.59 (1.91) | 14 |
| PostAL (cm) | 4.55 | 11.63 | 9.13 (1.22) | 13 |
| HH (cm) | 3.65 | 6.88 | 5.05 (0.72) | 14 |
| BH (cm) | 5.17 | 10.02 | 7.45 (1.04) | 14 |
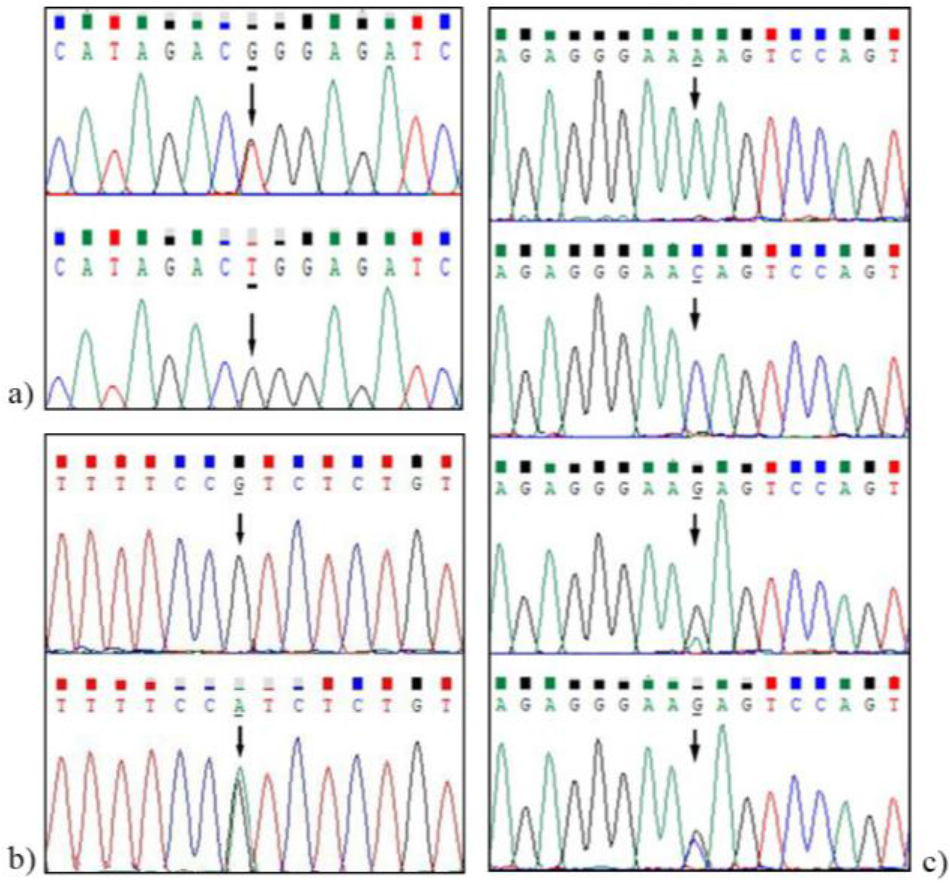
Fig. 1.
Partial sequence of polymorphisms in the lep gene of Dicentrarchus labrax. (a) g.11005646A>C; (b) g.11004767C>T; (c) g.11005020T>C>G. Chromatograms were generated from the reverse sequence
Table 3.
Single-nucleotide polymorphisms (SNPs) identified in the Dicentrarchus labrax lep gene
| SNP | Position | Ref. seq. | SNP site | Region | Mutations |
|---|---|---|---|---|---|
| 1 | 11005825* | T | C>T>Y | Intron 1 | - |
| 2 | 11005698* | C | T>C>Y | Intron 1 | - |
| 3 | 11005646* | A | C>A>M | Intron 1 | - |
| 4 | 11005643* | C | T>C>Y | Intron 1 | - |
| 5 | 11005525* | C | A>C>M | Intron 1 | - |
| 6 | 11005514* | C | T>C>Y | Intron 1 | - |
| 7 | 11005335* | G | A>G>R | Intron 1 | - |
| 8 | 11005304* | A | G>A>R | Intron 1 | - |
| 9 | 11005020* | T | C>G>T>B | Intron2 | - |
| 10 | 11004804* | G | A>G>R | Exon 3 | Synonym (glutamic acid) |
| 11 | 11004767* | C | T>C>Y | Exon 3 | Non synonym (arginine → tryptophan) |
| 12 | 11004714* | G | A>G>R | Exon 3 | Synonym (lysine) |
Table 4.
Genetic diversity parameters based on single-nucleotide polymorphisms in the Dicentrarchus labrax lep gene
| Locus | Number of samples | MAF | He | Ho | PIC | HWE |
|---|---|---|---|---|---|---|
| 11004714G>A | GG: 252 GA: 140 AA: 8 | 0.195 | 0.314 | 0.350 | 0.265 | 0.021* |
| 11004767C>T | CC: 124 CT: 276 | 0.345 | 0.452 | 0.690 | 0.350 | 0.000* |
| 11004804G>A | GG: 200 GA: 192 AA: 8 | 0.260 | 0.385 | 0.480 | 0.311 | 0.000* |
| 11005304A>G | AA: 208 AG: 192 | 0.240 | 0.365 | 0.480 | 0.298 | 0.000* |
| 11005335G>A | GG: 292 GA: 84 AA: 24 | 0.165 | 0.276 | 0.210 | 0.238 | 0.000* |
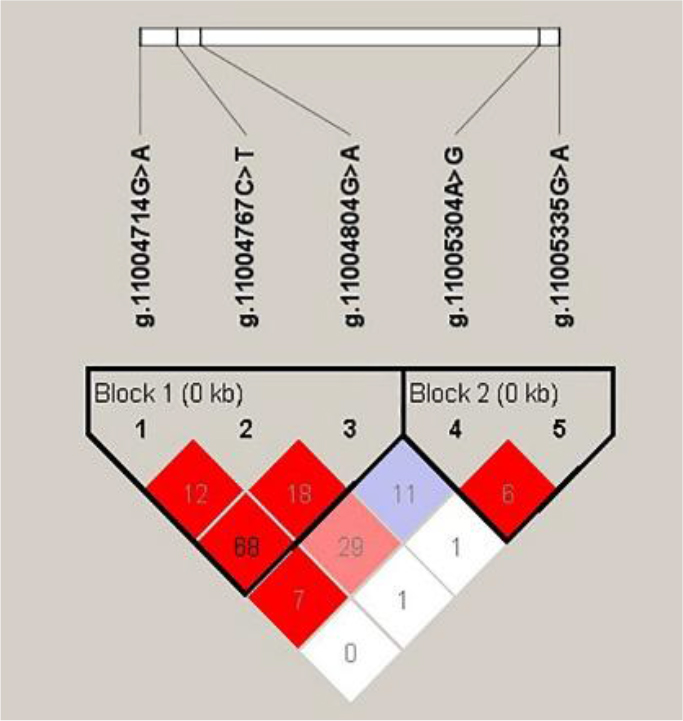
Fig. 2.
Linkage disequilibrium plot of the Dicentrarchus labrax lep gene. The values represent r2 × 100
Table 5.
Associations between the lep genotypes and the growth traits of Dicentrarchus labrax
| Trait | Locus | Genotype | P-value | ||
|---|---|---|---|---|---|
| GG | GA | AA | |||
| TW (g) | g.11004714 G>A | 433.72 ±19.60ab | 513.35 ±25.37a | 359.98 ±19.11b | 0.033 |
| FW (g) | g.11004714 G>A | 229.57 ± 10.34ab | 273.60 ±13.39a | 187.70 ±7.58b | 0.024 |
| SL (cm) | g.11004714 G>A | 28.67 ±0.43ab | 30.44 ± 0.55a | 26.80 ±2.40b | 0.027 |
| BL (cm) | g.11004714 G>A | 21.10 ±0.34ab | 22.40 ±0.40a | 19.34 ±1.75b | 0.022 |
| PostAL (cm) | g.11004714 G>A | 8.95 ±0.15ab | 9.54 ±0.19a | 8.23 ±0.81b | 0.027 |
| g.11004804 G>A | 8.84 ±0.16ab | 9.50 ±0.16a | 8.22 ±0.80b | 0.011 | |
Table 6.
Characterisation of haplotypes and association analysis with weight and primary body growth traits in Dicentrarchus labrax
| Haplotype | Frequency | TW (g) | FW (g) | SL (cm) | BL (cm) | BH (cm) | |
|---|---|---|---|---|---|---|---|
| Block 1 | GCG | 0.453 | 456.30 ± 11.06b | 244.20 ± 5.97b | 29.03 ± 0.23b | 21.54 ± 0.18b | 7.50 ± 0.07 |
| GTG | 0.287 | 435.37 ± 17.78b | 227.18 ± 9.06ab | 29.35 ± 0.39b | 21.16 ± 0.28b | 7.28 ± 0.12 | |
| ACA | 0.177 | 494.58 ± 12.79ab | 265.17 ± 7.04ab | 30.18 ± 0.28ab | 22.10 ± 0.22ab | 7.57 ± 0.09 | |
| GTA | 0.040 | 554.56 ± 34.78a | 286.63 ± 19.12a | 31.27 ± 0.86a | 22.98 ± 0.58a | 7.79 ± 0.18 | |
| Block 2 | AG | 0.595 | 500.73 ± 10.47a | 265.28 ± 5.37a | 30.14 ± 0.23a | 22.09 ± 0.17a | 7.75 ± 0.07a |
| GG | 0.240 | 402.60 ± 16.48b | 215.41 ± 6.32b | 28.74 ± 0.28b | 21.01 ± 0.19b | 7.13 ± 0.09b | |
| AA | 0.165 | 392.69 ± 18.15b | 206.90 ± 10.56b | 27.73 ± 0.41b | 20.32 ± 0.29b | 6.82 ± 0.10b |
Table 7.
Characterisation of haplotypes and association analysis with segmental body growth traits in Dicentrarchus labrax
| Haplotype | Frequency | HL (cm) | PecAL (cm) | AL (cm) | PostAL (cm) | HH (cm) | |
|---|---|---|---|---|---|---|---|
| Block 1 | GCG | 0.453 | 8.25 ± 0.13 | 21.05 ± 0.21 | 13.52 ± 0.15b | 9.12 ± 0.10b | 5.04 ± 0.04 |
| GTG | 0.287 | 7.92 ± 0.14 | 21.06 ± 0.32 | 13.44 ± 0.19b | 8.93 ± 0.12ab | 5.01 ± 0.09 | |
| ACA | 0.177 | 8.17 ± 0.01 | 21.75 ± 0.24 | 13.95 ± 0.17ab | 9.47 ± 0.10ab | 5.22 ± 0.06 | |
| GTA | 0.040 | 8.33 ± 0.34 | 22.75 ± 0.71 | 14.66 ± 0.42a | 9.66 ± 0.32a | 5.26 ± 0.14 | |
| Block 2 | AG | 0.595 | 8.29 ± 0.11a | 21.70 ± 0.20a | 13.93 ± 0.13a | 9.37 ± 0.08a | 5.24 ± 0.05a |
| GG | 0.240 | 8.03 ± 0.13a | 20.75 ± 0.22b | 13.28 ± 0.14b | 8.96 ± 0.09b | 4.89 ± 0.06b | |
| AA | 0.165 | 7.51 ± 0.12b | 20.03 ± 0.33b | 12.82 ± 0.22b | 8.53 ± 0.01c | 4.61 ± 0.06c |
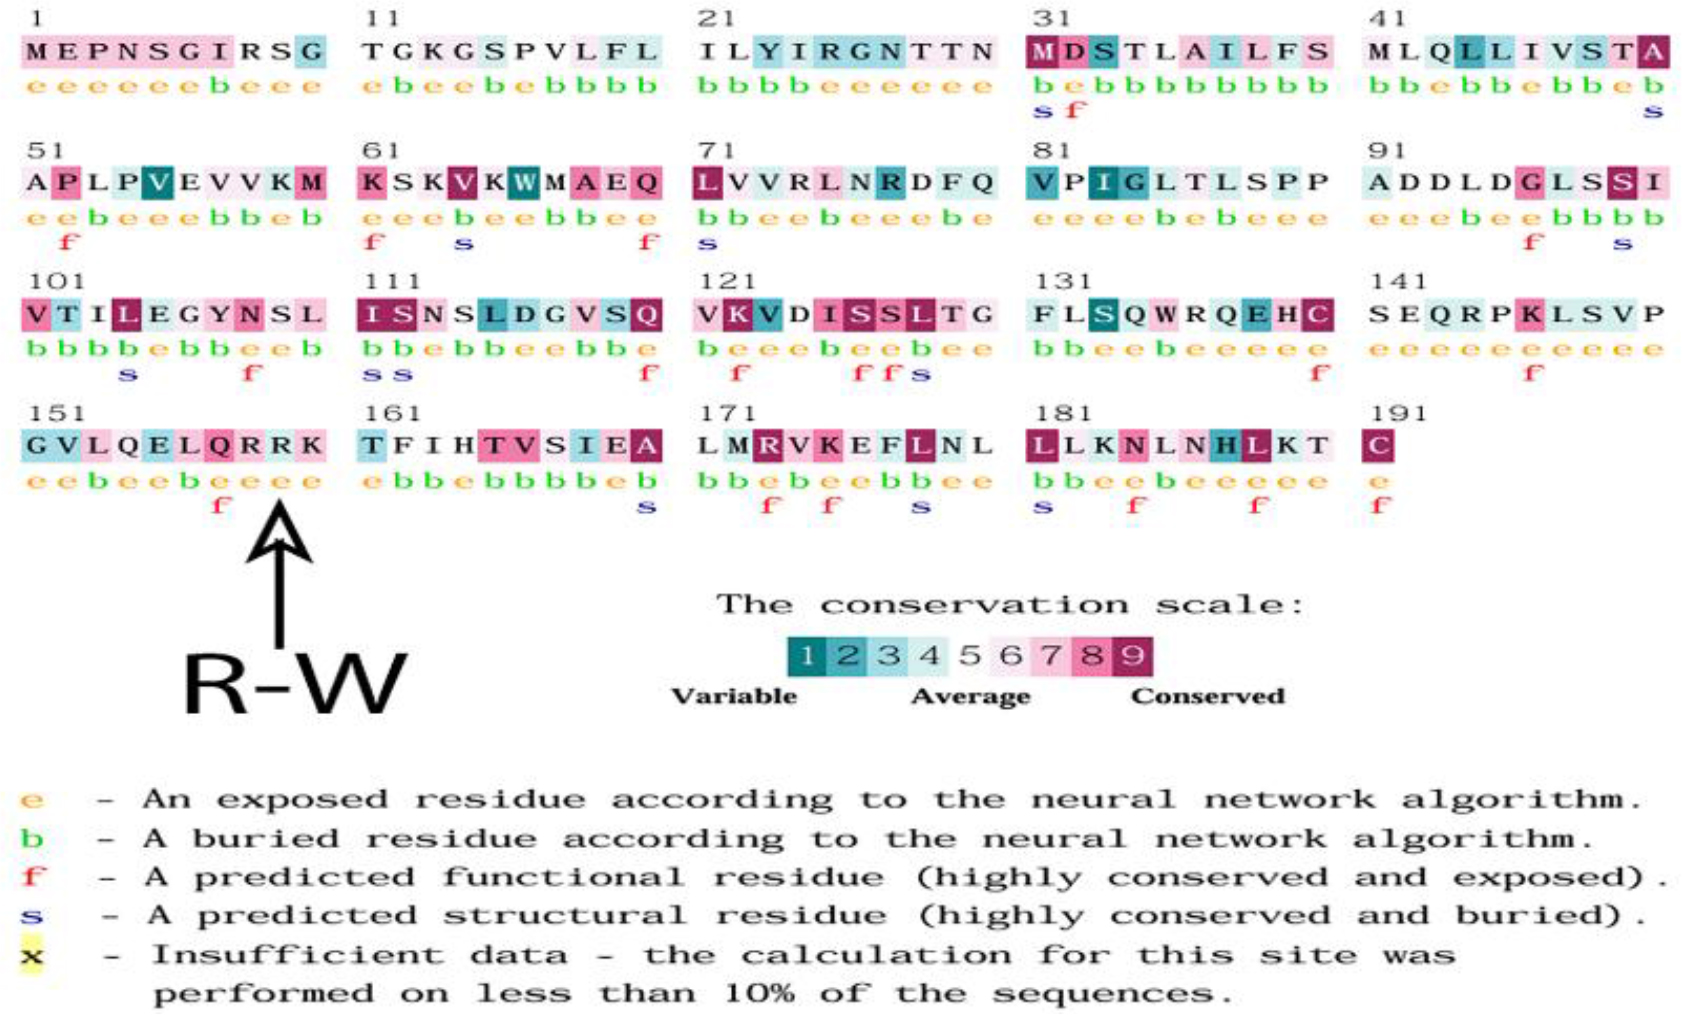
Fig.3.
ConSurf database analysis of the leptin isoform X1 protein of Dicentrarchus labrax
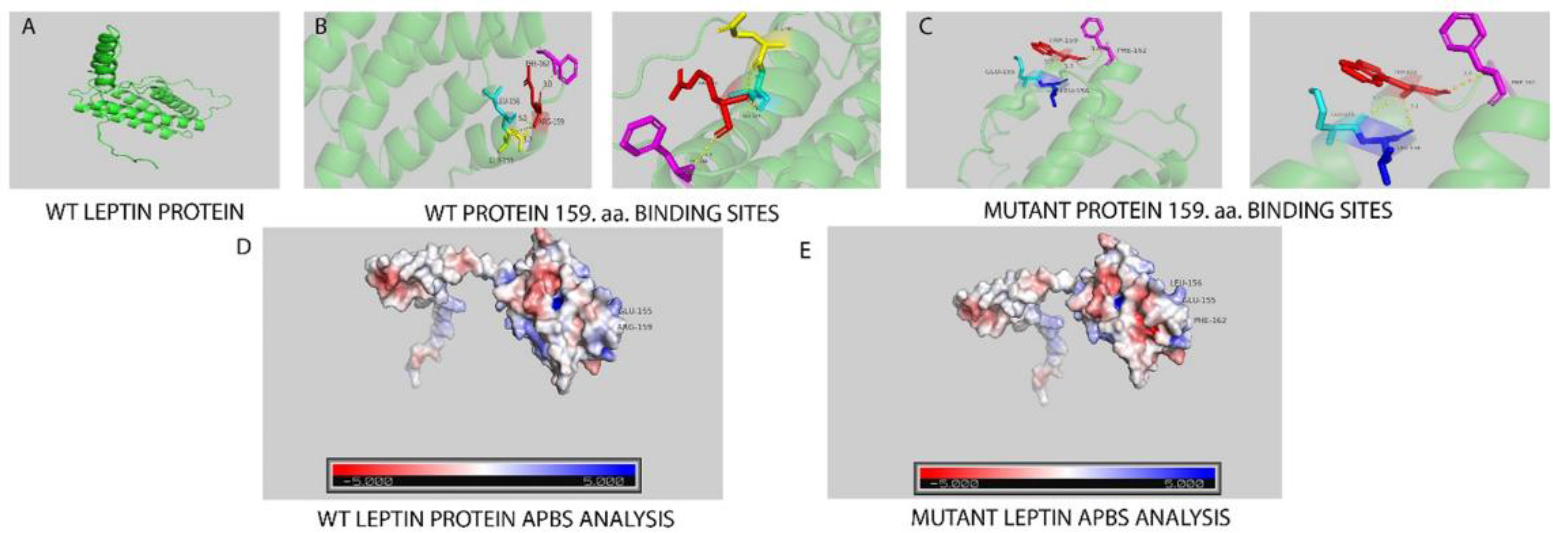
Fig.4.
Structural comparison of wild-type and mutant leptin isoform X1. The conservation analysis of the leptin isoform X1 protein predicted that the arginine amino acid located at position 159, which is marked, is not in an evolutionarily conserved region