
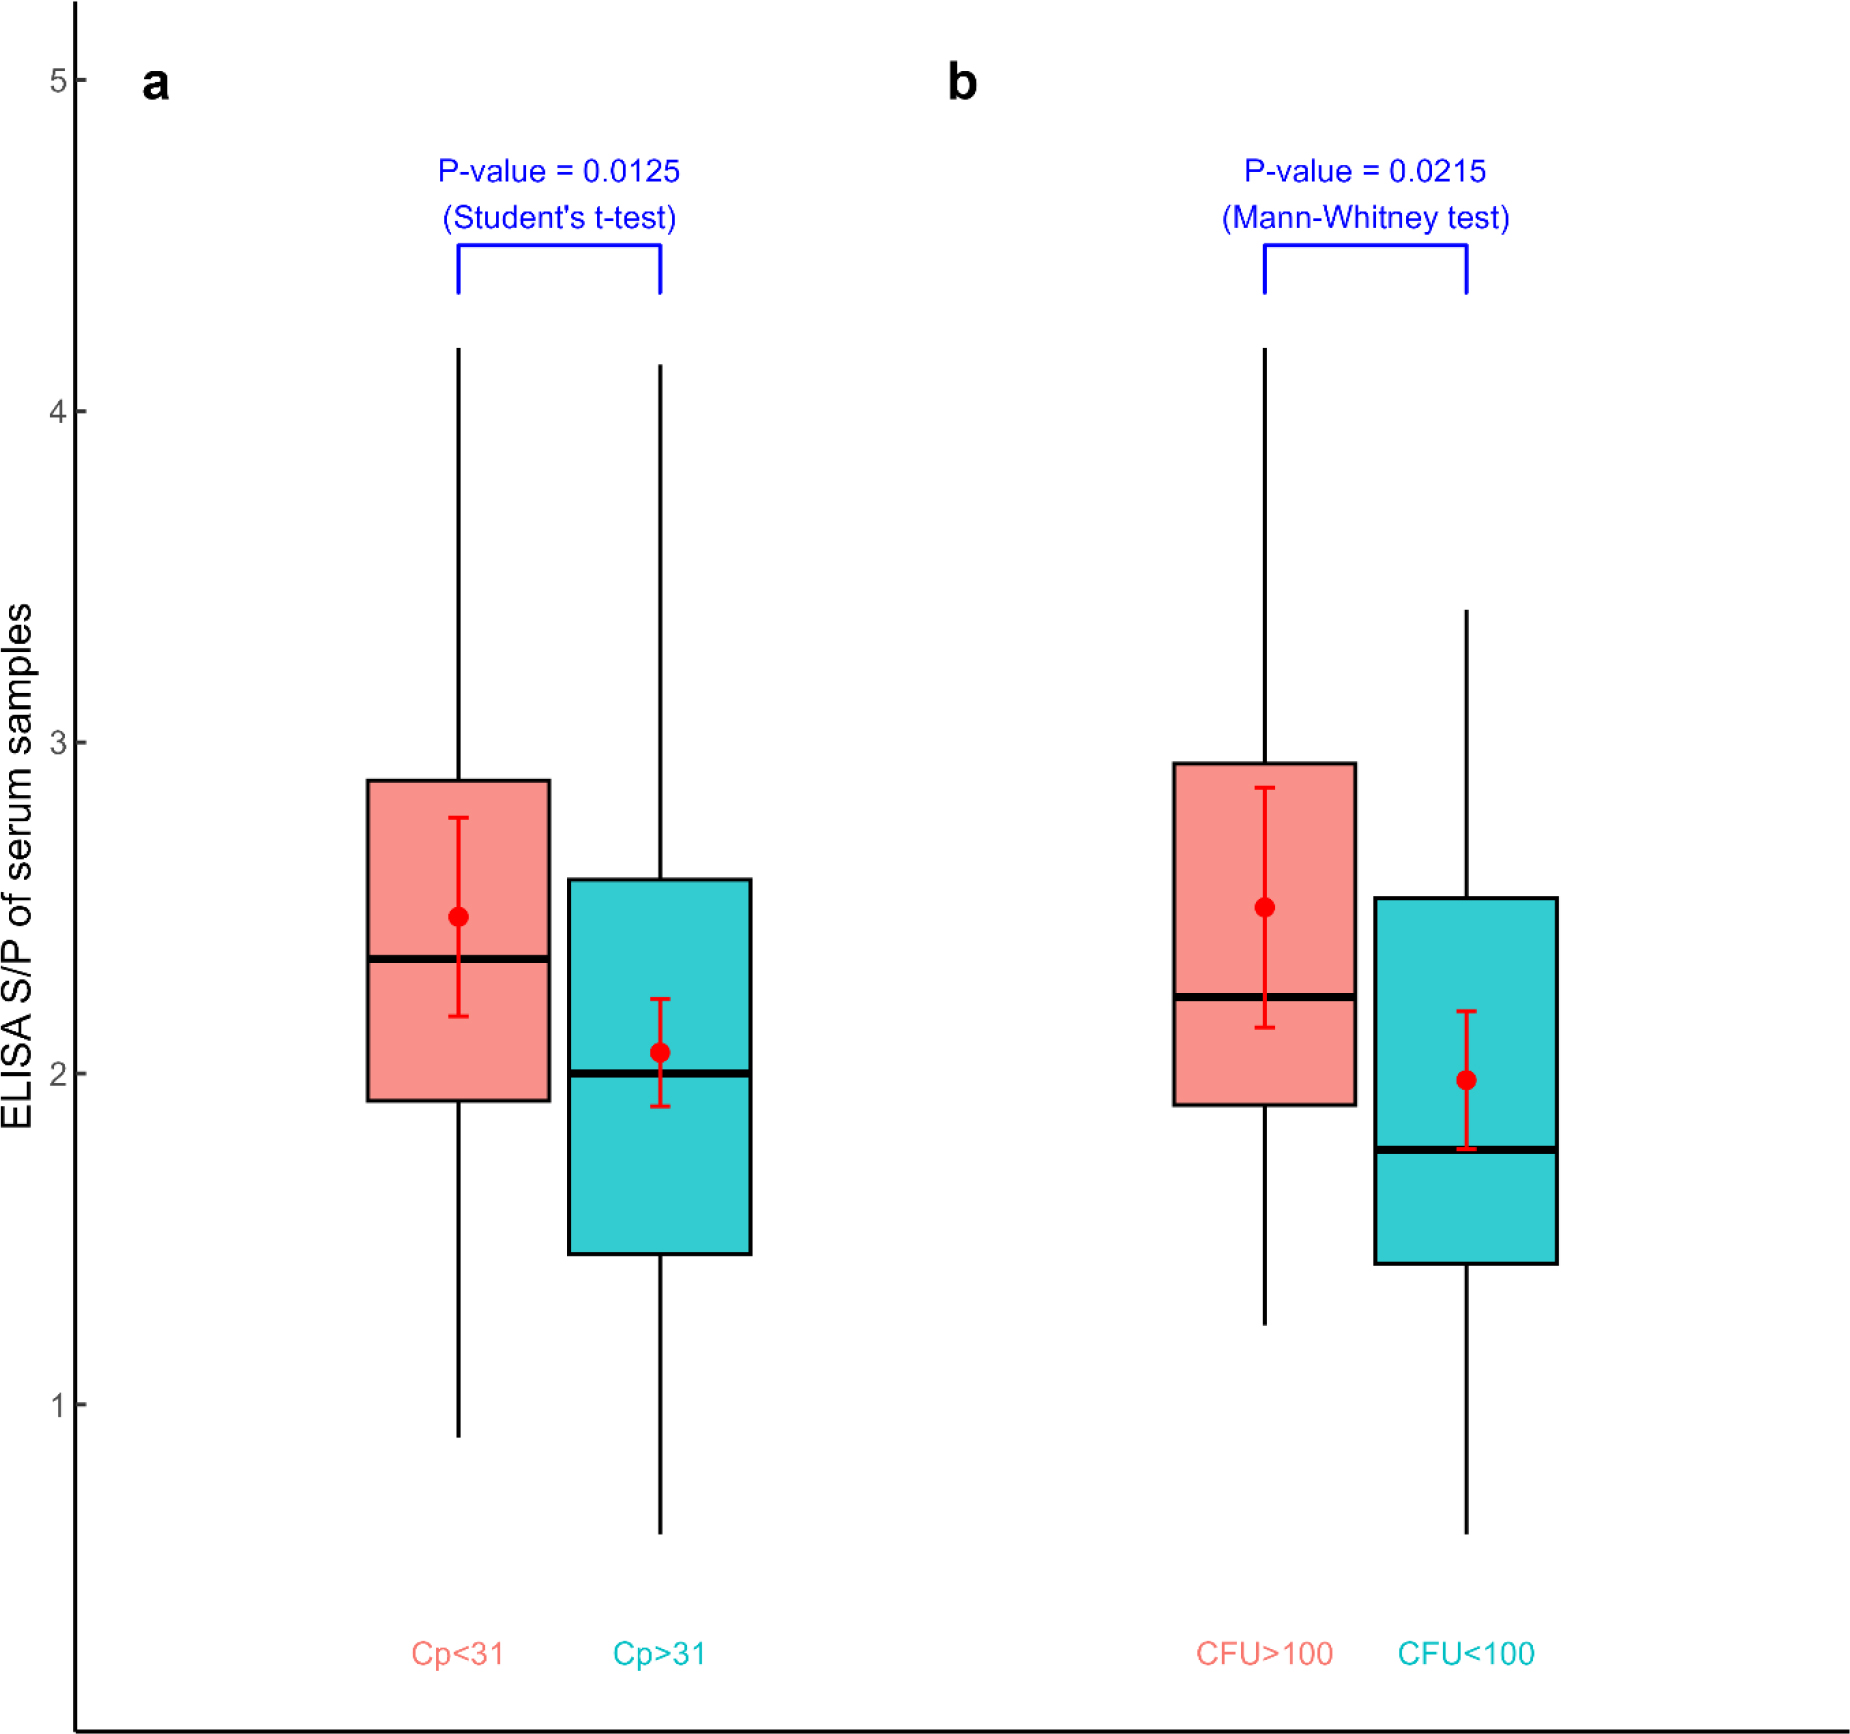
Fig. 1.
ELISA serum-to-positive (S/P) values of serum samples. (a) Animals grouped according to their qPCR crossing point (Cp) values, representing moderate-to-high (Cp < 31) and low (Cp ≥ 31) Mycobacterium avium subsp. paratuberculosis (MAP) faecal shedding. (b) Animals grouped according to their CFU count, representing high (CFU ≥ 100) and low (CFU < 100) MAP faecal shedding. Red dots and red line segments within the box plots indicate the group means of the S/P values and the 95% confidence intervals of these means
Table 1.
Results of Student’s t-test for the significance of differences between sample-to-positive ratios (S/P) in ELISA among animals with moderate-to-high (qPCR crossing point (Cp < 31) and low (Cp ≥ 31) Mycobacterium avium subsp. paratuberculosis faecal shedding
| Cp > 27 | Cp < 27 | P-value | |
|---|---|---|---|
| Mean S/P | 2.14 | 2.39 | 0.6025 |
| Number of animals | 107 | 15 | |
| Cp ≥ 31 | Cp < 31 | ||
| Mean S/P | 2.06 | 2.47 | 0.0125 |
| Number of animals | 90 | 32 |
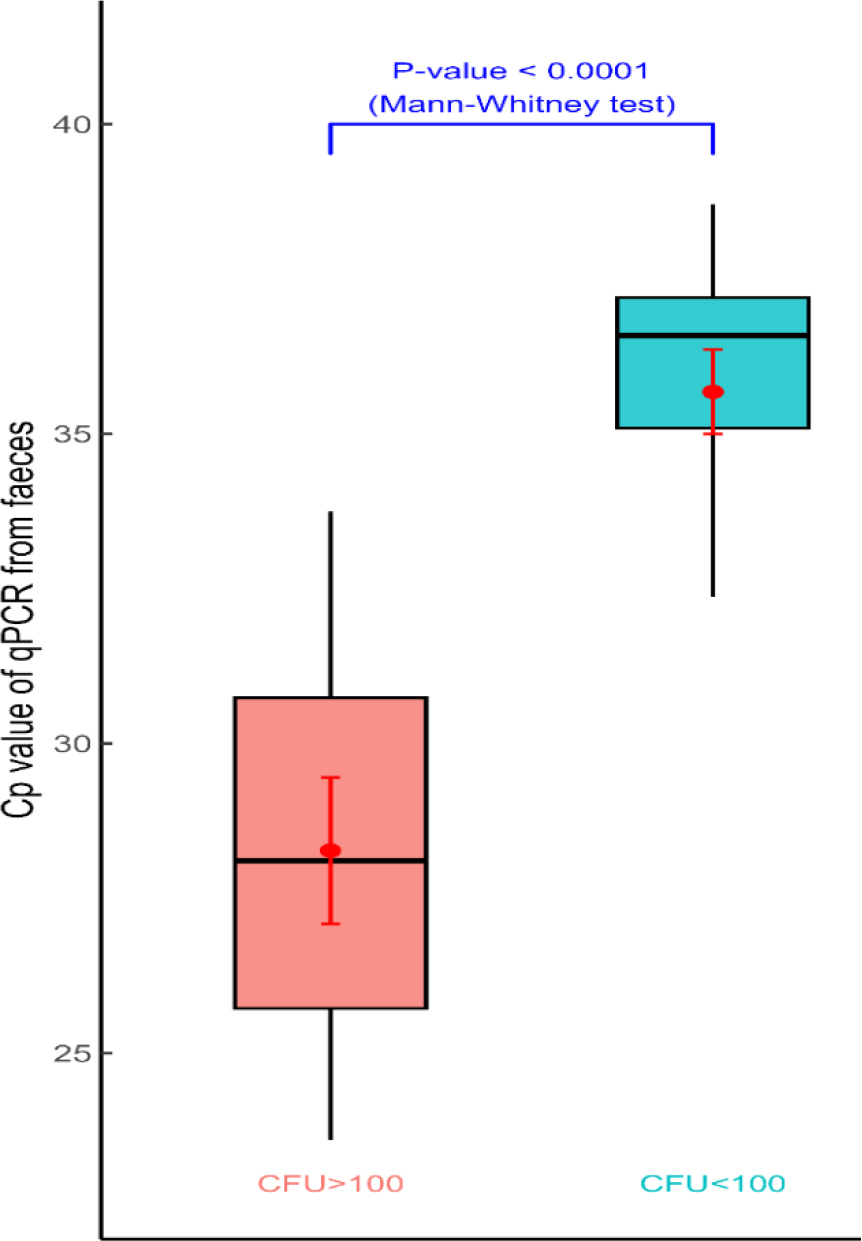
Fig. 2.
Faecal sample crossing point (Cp) values from qPCR. Samples grouped according to their CFU count, representing high (CFU ≥ 100) and low (CFU < 100) Mycobacterium avium subsp. paratuberculosis faecal shedding. Red dots and red line segments within the box plots indicate the group means of the Cp values and the 95% confidence intervals of these means
Table 2.
Results of Mann–Whitney U test for the significance of differences between sample-to-positive ratios (S/P) in ELISA and crossing points (Cp) from qPCR of samples with lower (CFU < 100) and higher (CFU ≥ 100) Mycobacterium avium subsp. paratuberculosis faecal shedding
| CFU < 100 | CFU ≥ 100 | P-value | |
|---|---|---|---|
| Mean S/P | 1.98 | 2.5 | 0.0215 |
| Mean Cp | 35.68 | 28.27 | <0.0001 |
| Number of animals | 56 | 27 |