
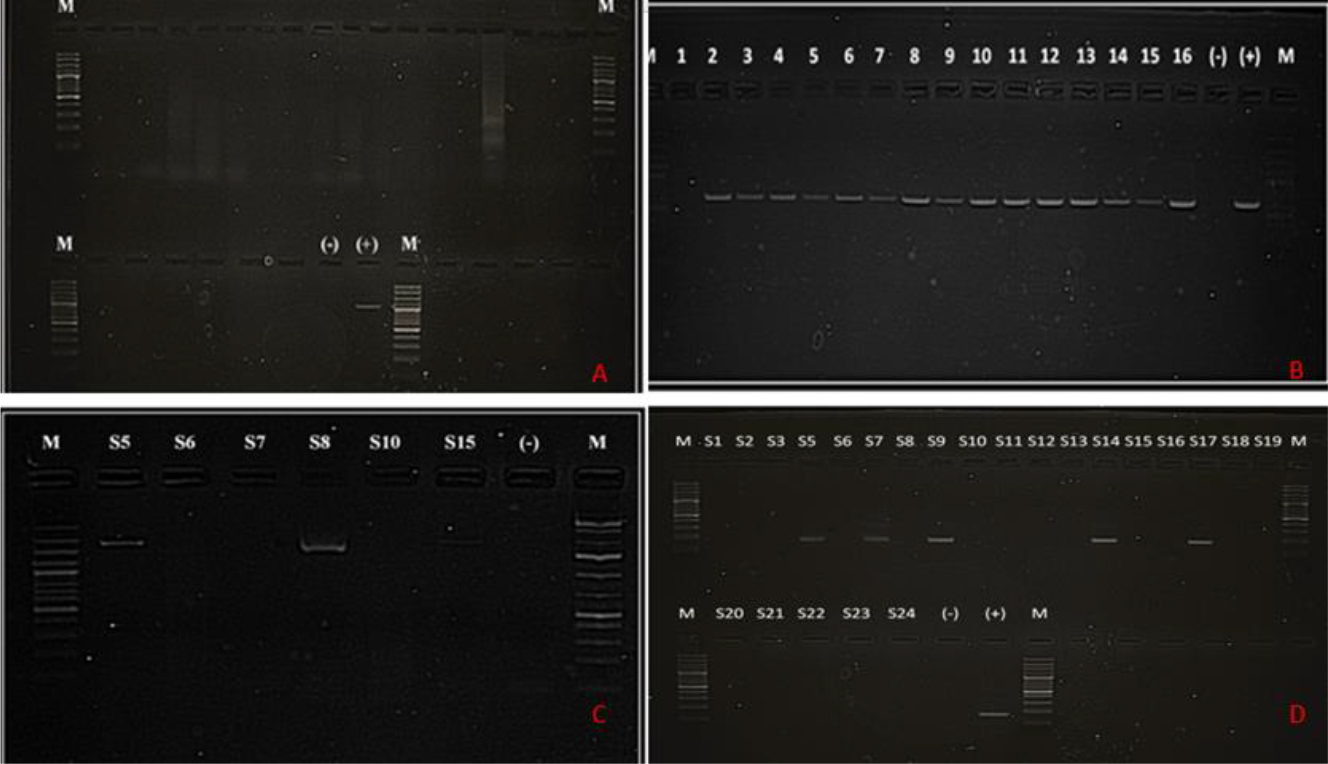
Fig. 1.
(A) Gel image of PCR results with CAdV-1/2-specific primer sets. All 24 samples of the full assortment were negative for CAdV-1/2. M – 100 bp marker; (-) – negative control; (+) – CAdV-2 positive control showing a band at 1,031 bp. (B) Gel image of PCR results with CPV-specific primer sets. Fifteen out of sixteen faecal samples were positive for CPV. M – 100 bp marker; (-) – negative control; (+) – CPV positive control showing a band at 630 bp. (C) Gel image of PCR results with CDV-specific primer sets. Three out of six nasal swab samples were positive for CDV. M – marker; (-) – negative control. (D) Gel images of second-round nested PCR results with CHV-1-specific primer sets. Five out of twenty-three nasal swab samples were positive for CHV-1. M – marker; (-) – negative control; (+) – CHV-1 positive control showing a band at 170 bp
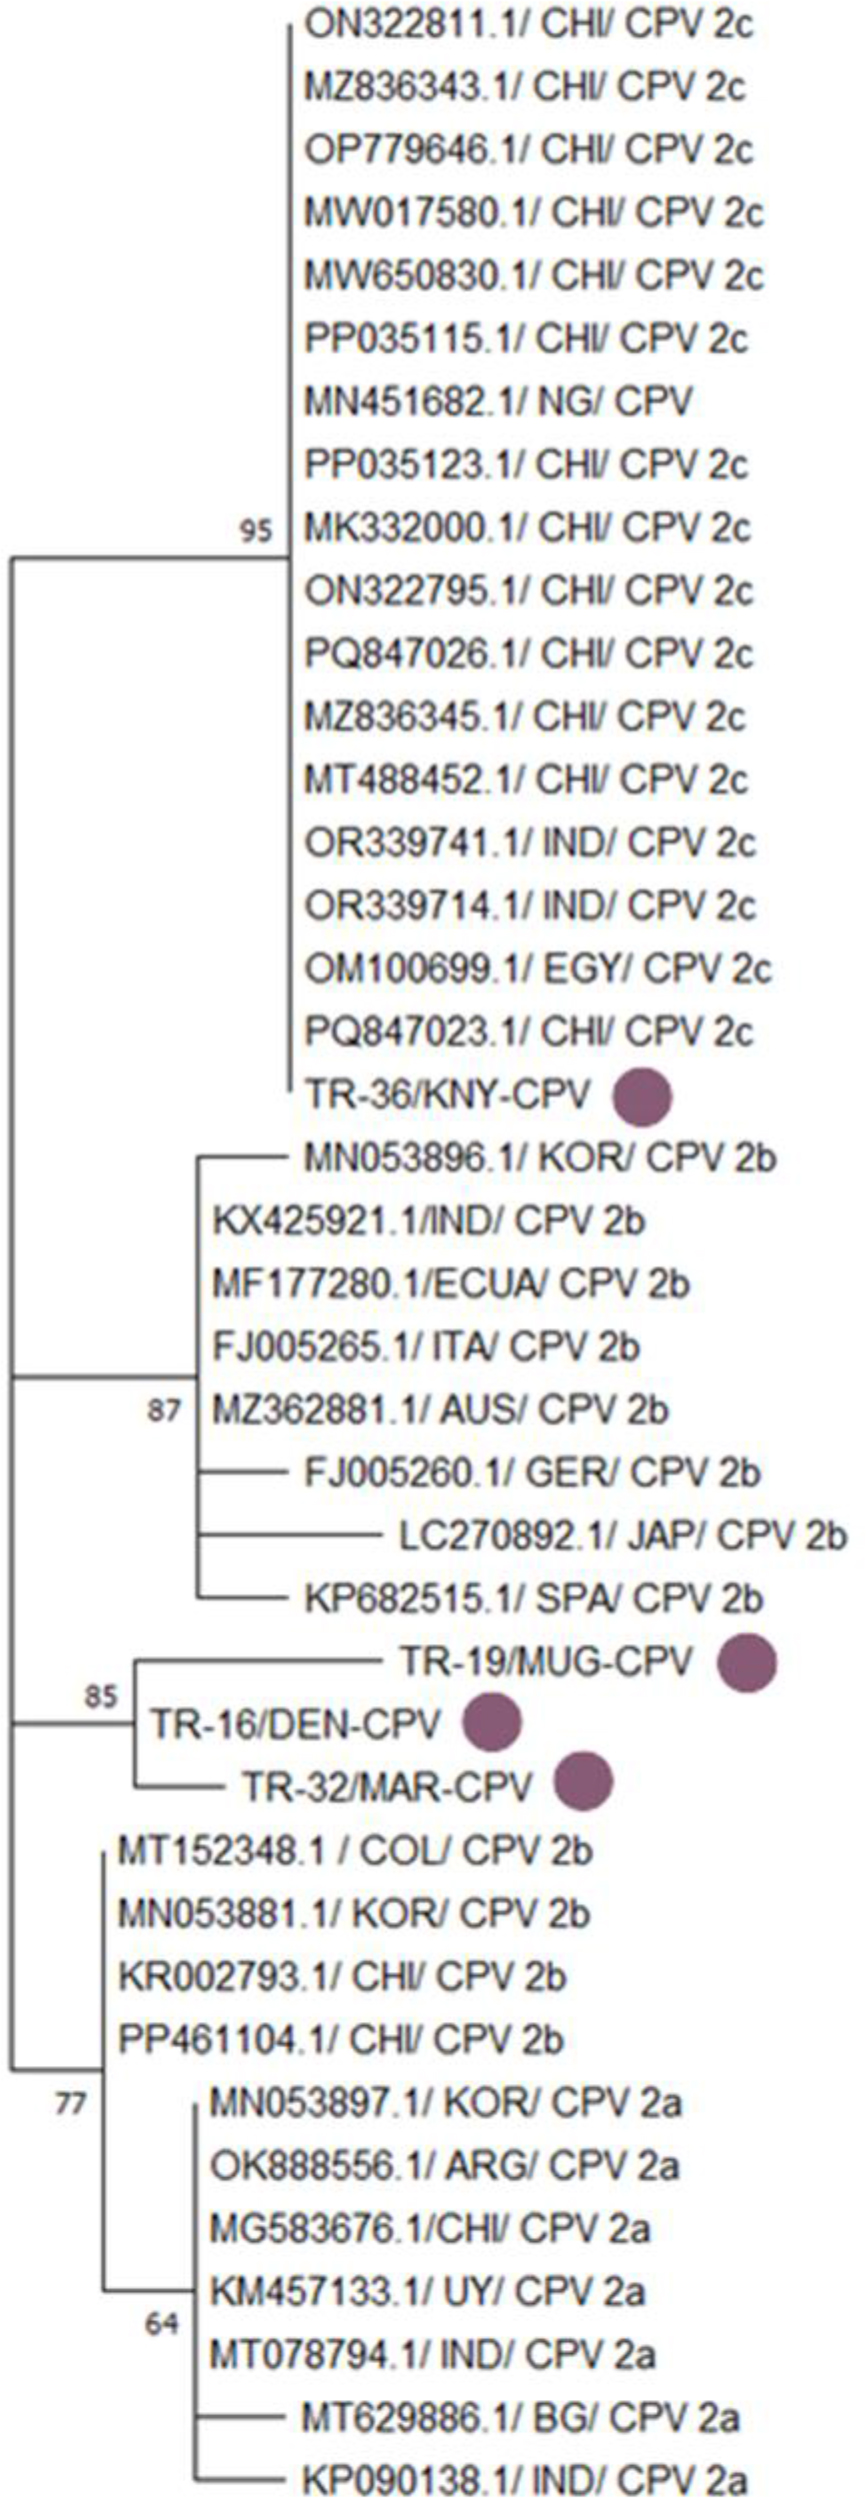
Fig. 2.
Phylogenetic tree based on the partial VP2 gene of canine parvovirustype 2 (CPV 2) constructed using the neighbour-joining method. Bootstrap analysis was performed with 1,000 repetitions. CHI – Chinese origin; NG – Nigerian origin; IND – Indian origin; EGY – Egyptian origin; KNY – origin in Konya province of Türkiye; KOR – South Korean origin; ECUA – Ecuadorian origin; ITA – Italian origin; AUS – Australian origin; GER – German origin; JAP – Japanese origin; SPA – Spanish origin; MUG – origin in Muğla province of Türkiye; DEN – origin in Denizli province of Türkiye; MAR – origin in Kahramanmaraş province of Türkiye; COL – Colombian origin; ARG – Argentinian origin; UY – Uruguayan origin; BG – Bangladeshi origin. Purple dots indicate isolates obtained in the present research. Numbers on tree branches are bootstrap support values
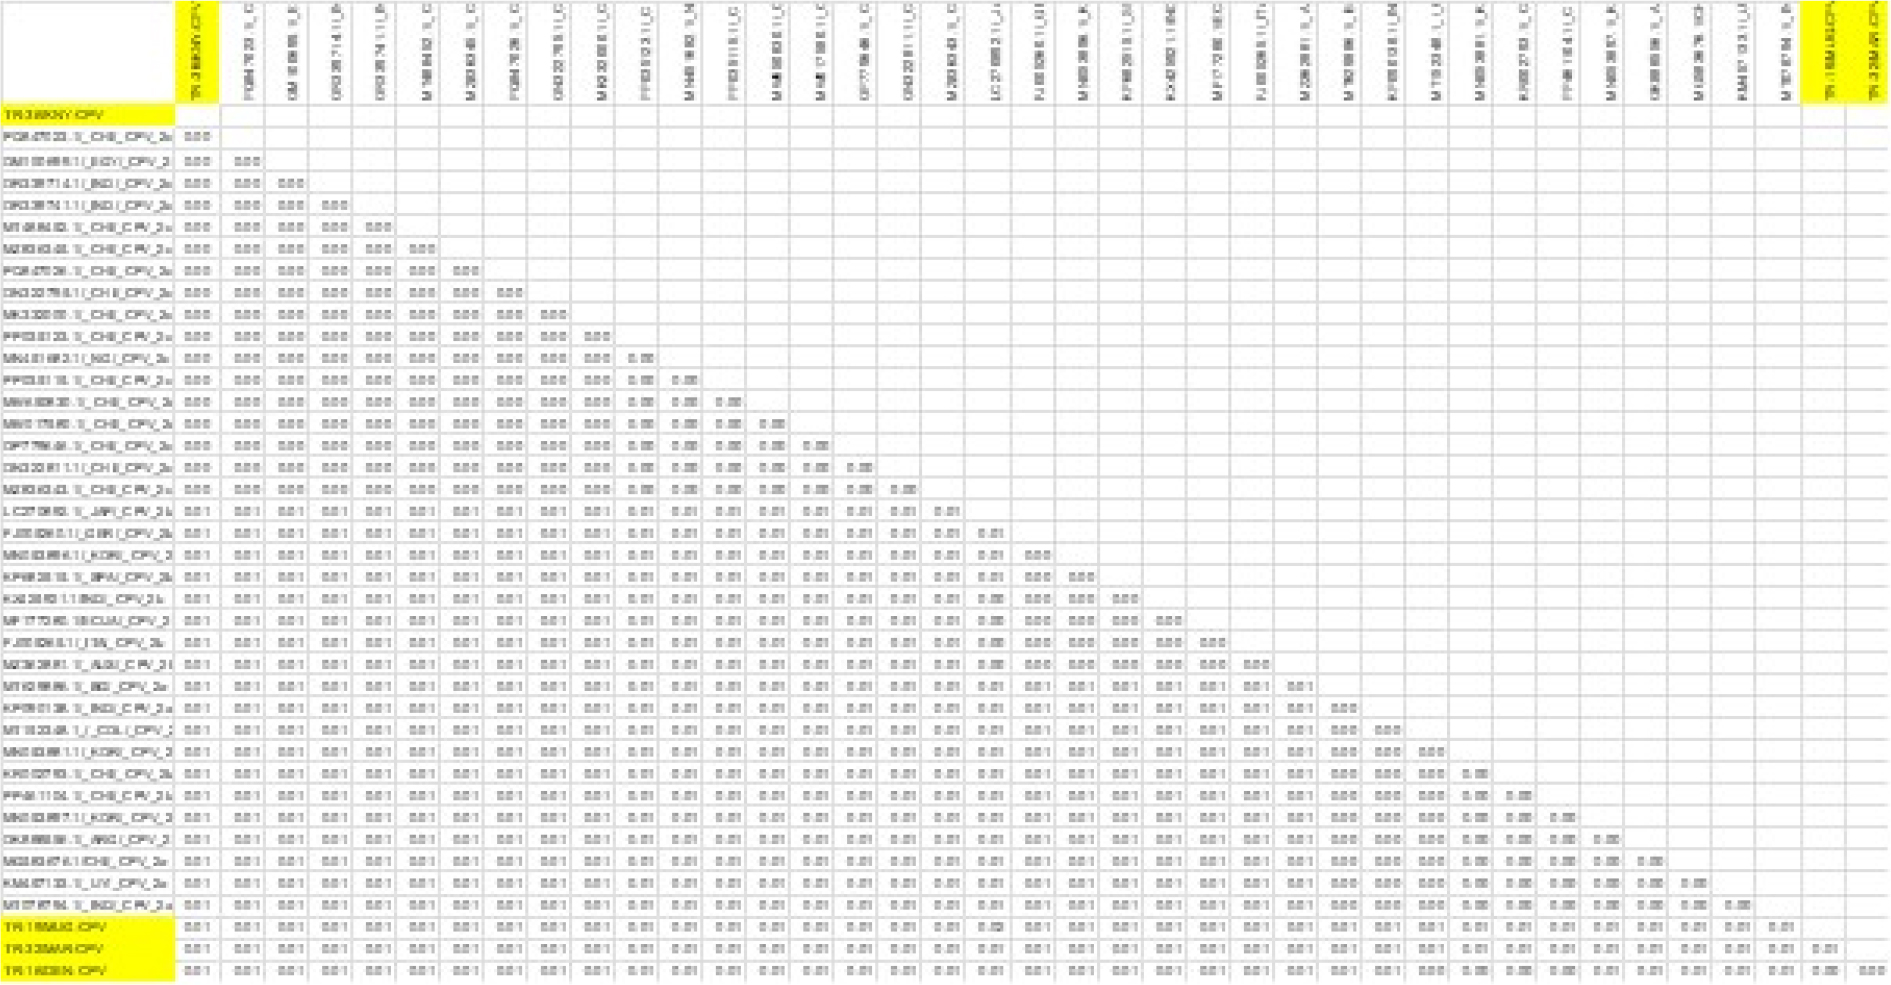
Fig. 3.
Results of genetic distance analysis of canine parvovirus type 2 (CPV-2) sequences. VP2-region sequences of CPV-2 isolates were obtained from the NCBI BLAST database
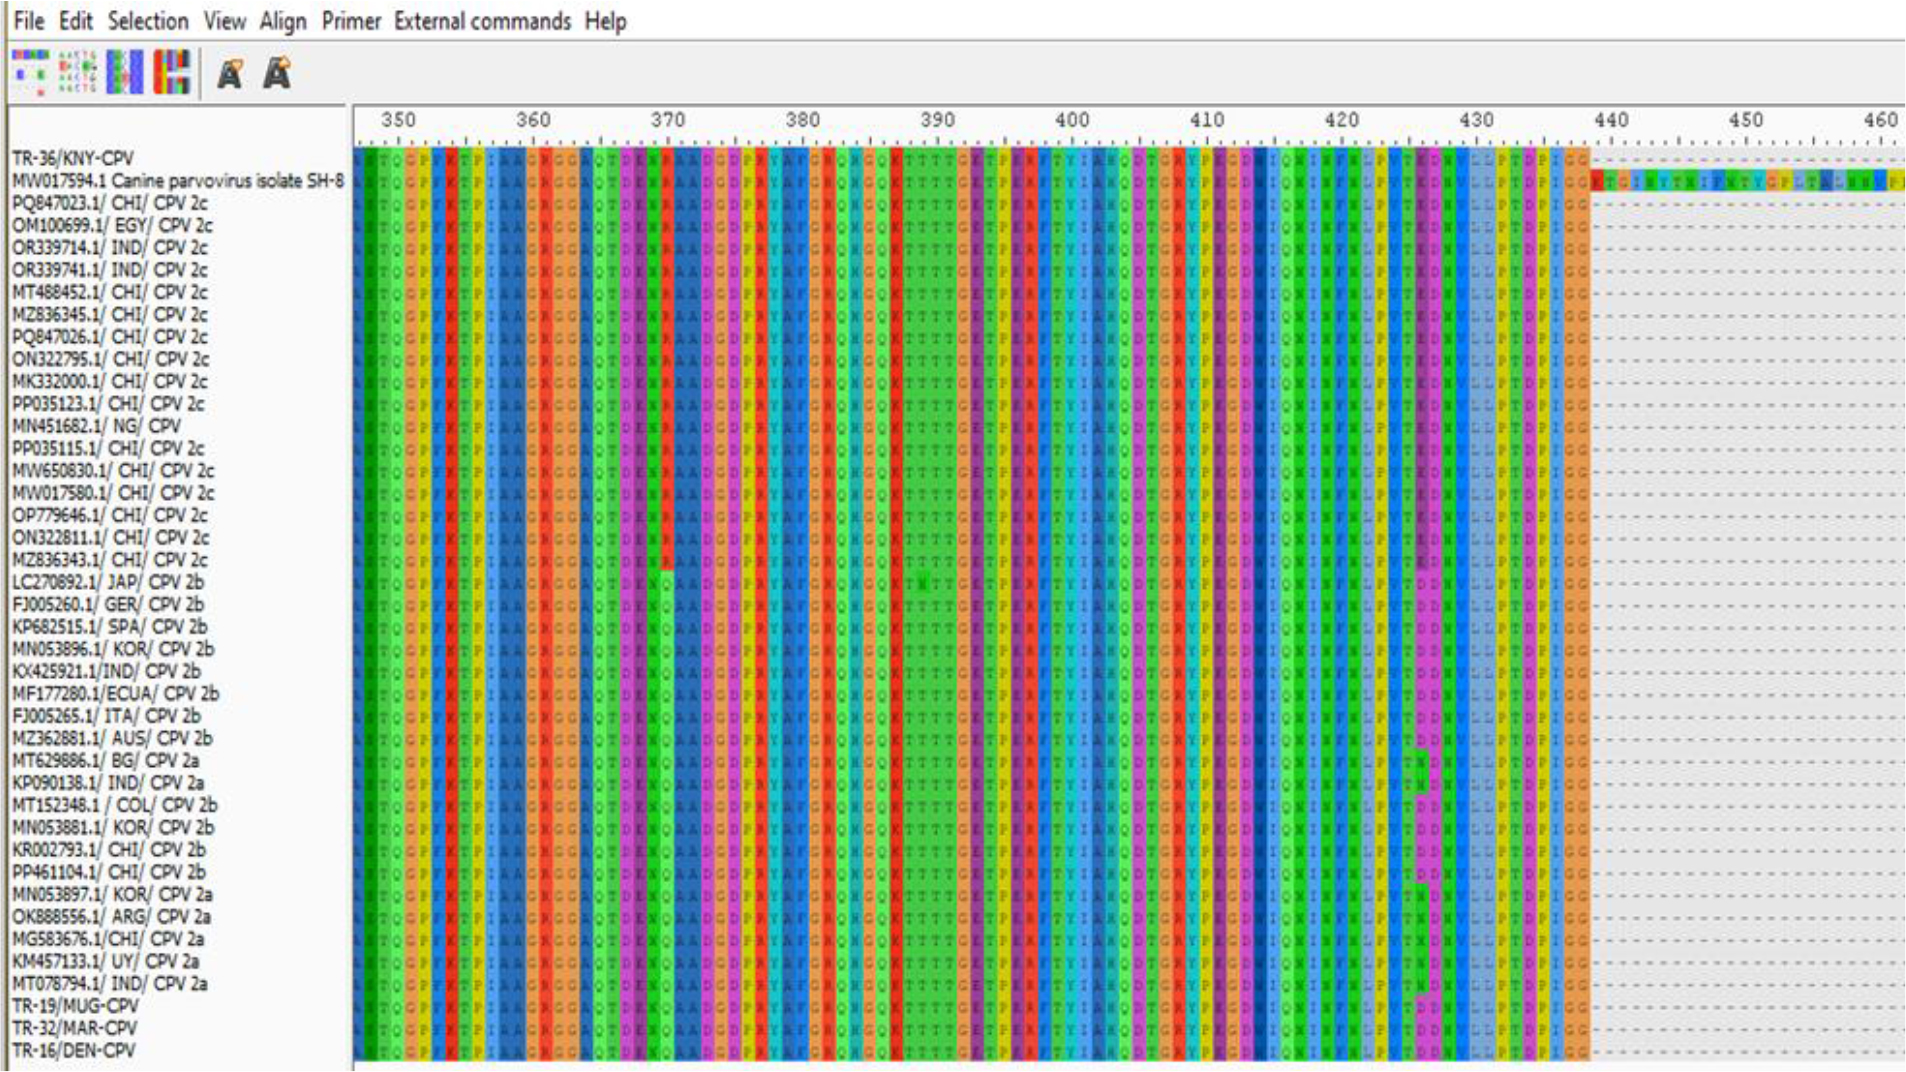
Fig. 4.
Canine parvovirus type 2 (CPV-2) amino acid changes in Turkish strains isolated in this study (at the top and bottom of the list) and strains logged in GenBank
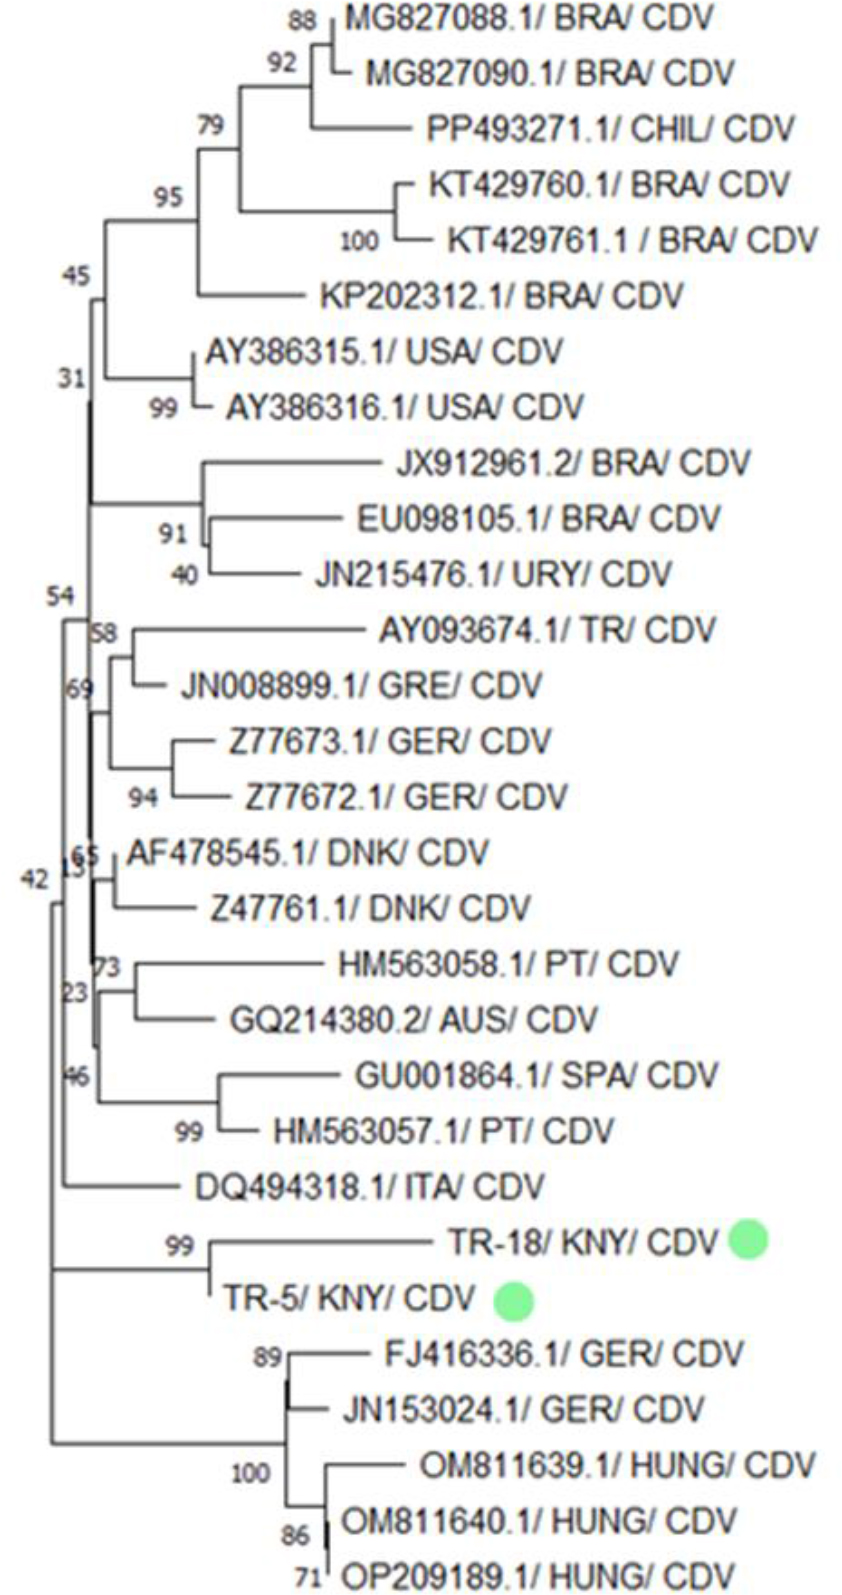
Fig. 5.
Phylogenetic tree based on the partial H gene of canine distemper virus (CDV) constructed using the neighbour-joining method. Bootstrap analysis was performed with 1,000 repetitions. BRA – Brazilian origin; CHIL – Chilean origin; USA – US American origin; URY – Uruguayan origin; TR – Turkish origin; GRE – Greek origin; GER – German origin; DNK – Danish origin; PT – Portuguese origin; AUS – Austrian origin; SPA – Spanish origin; ITA – Italian origin; KNY – origin in Konya province of Türkiye; HUNG – Hungarian origin. Green dots indicate isolates obtained in the present research. Numbers on tree branches are bootstrap support values
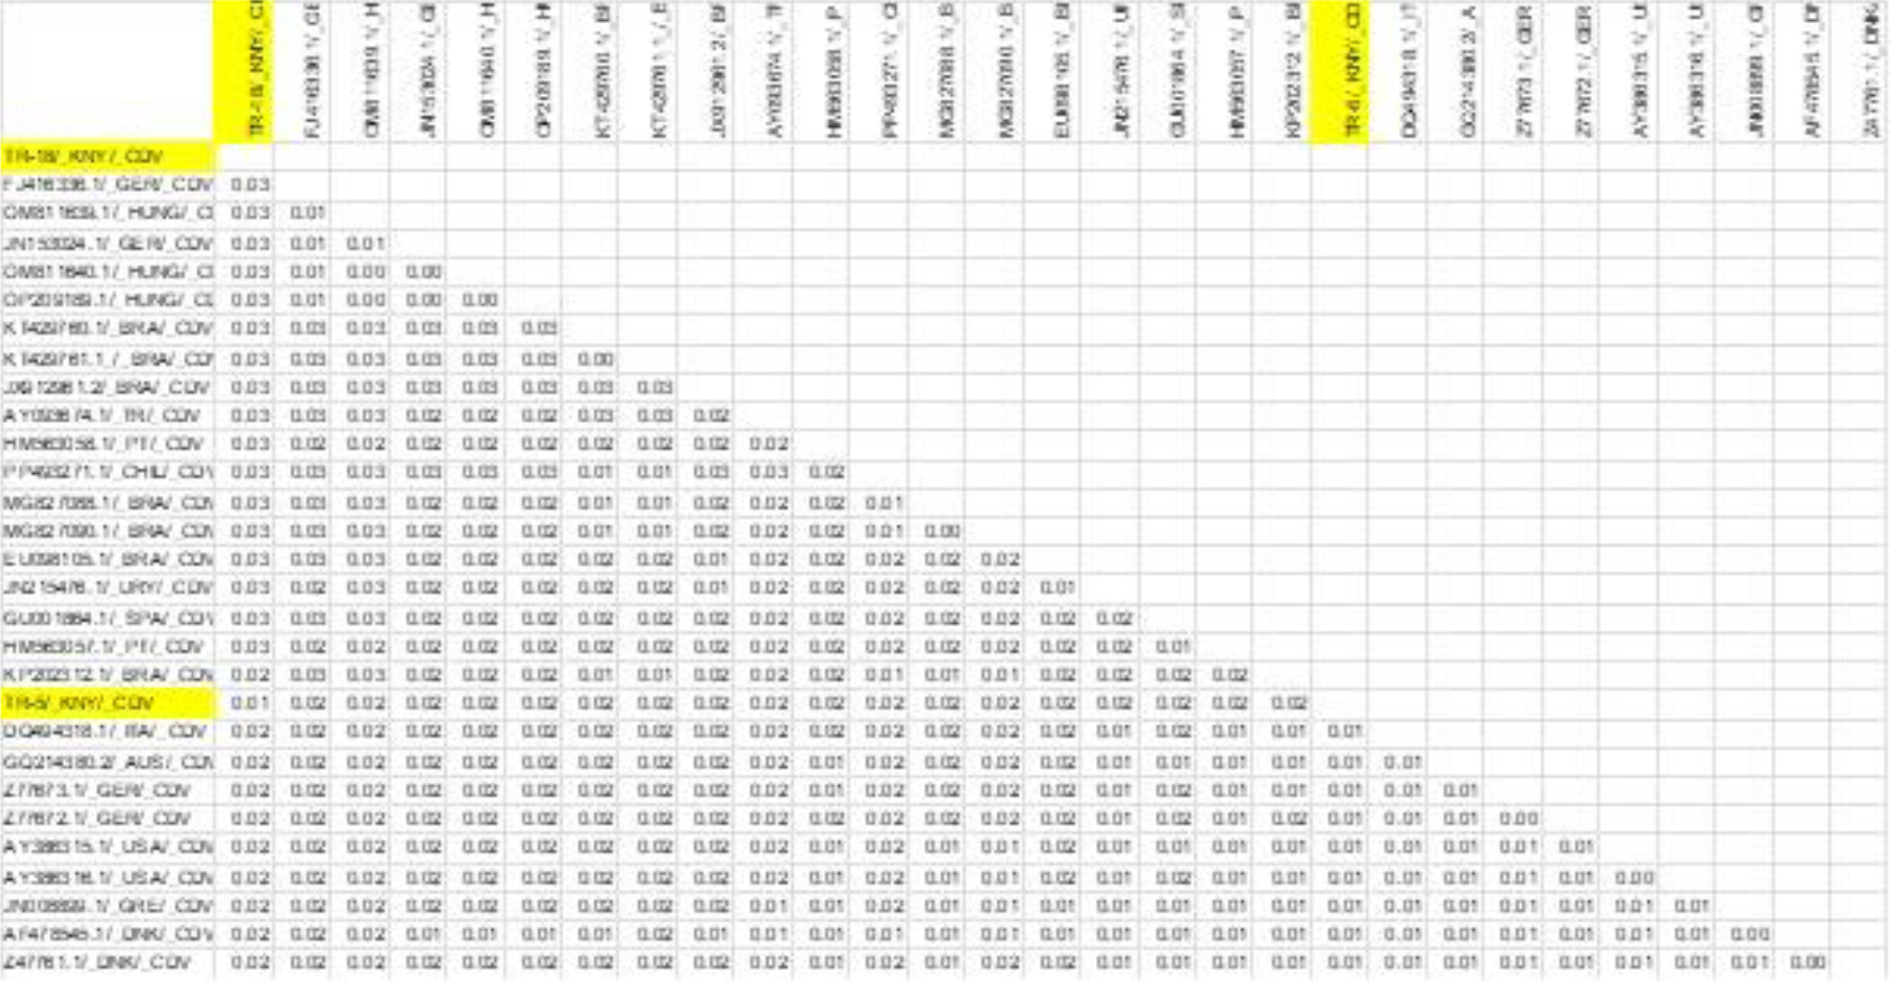
Fig. 6.
Results of genetic distance analysis of canine distemper virus (CDV) sequences. H-region sequences of CDV isolates were obtained from the NCBI BLAST database. Sequences obtained in the present research are highlighted in yellow
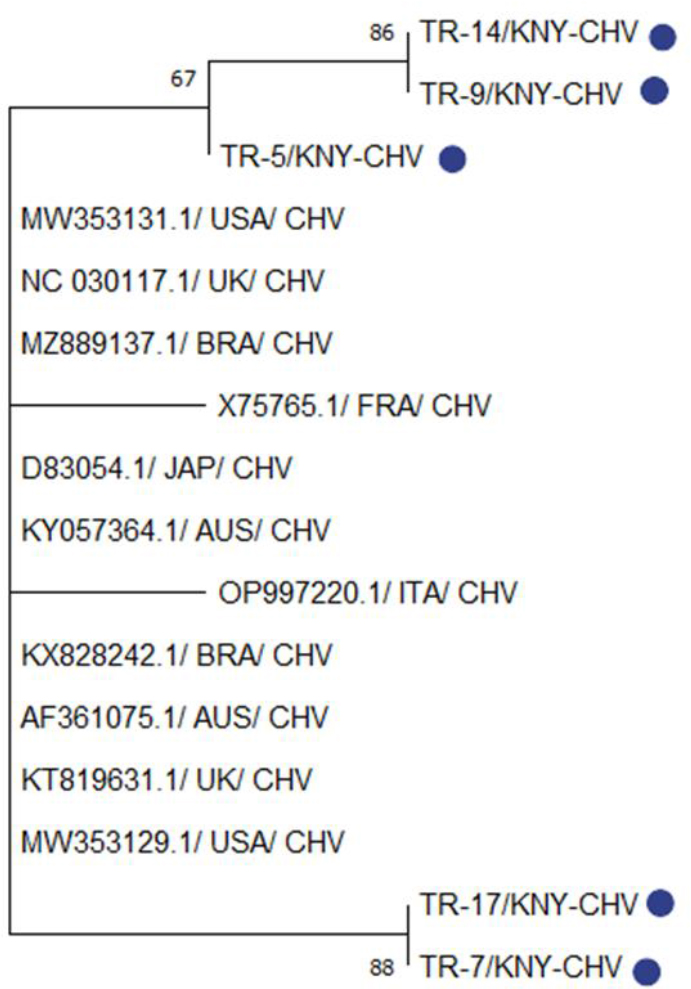
Fig. 7.
Phylogenetic tree based on the partial TK gene of canine herpesvirus (CHV) constructed using the neighbour-joining method. Bootstrap analysis was performed with 1,000 repetitions. KNY – origin in Konya province of Türkiye; USA – US American origin; UK – United Kingdom origin; BRA – Brazilian origin; FRA – French origin; JAP – Japanese origin; AUS – Australian origin; ITA – Italian origin. Blue dots indicate isolates obtained in the present research. Numbers on tree branches are bootstrap support values
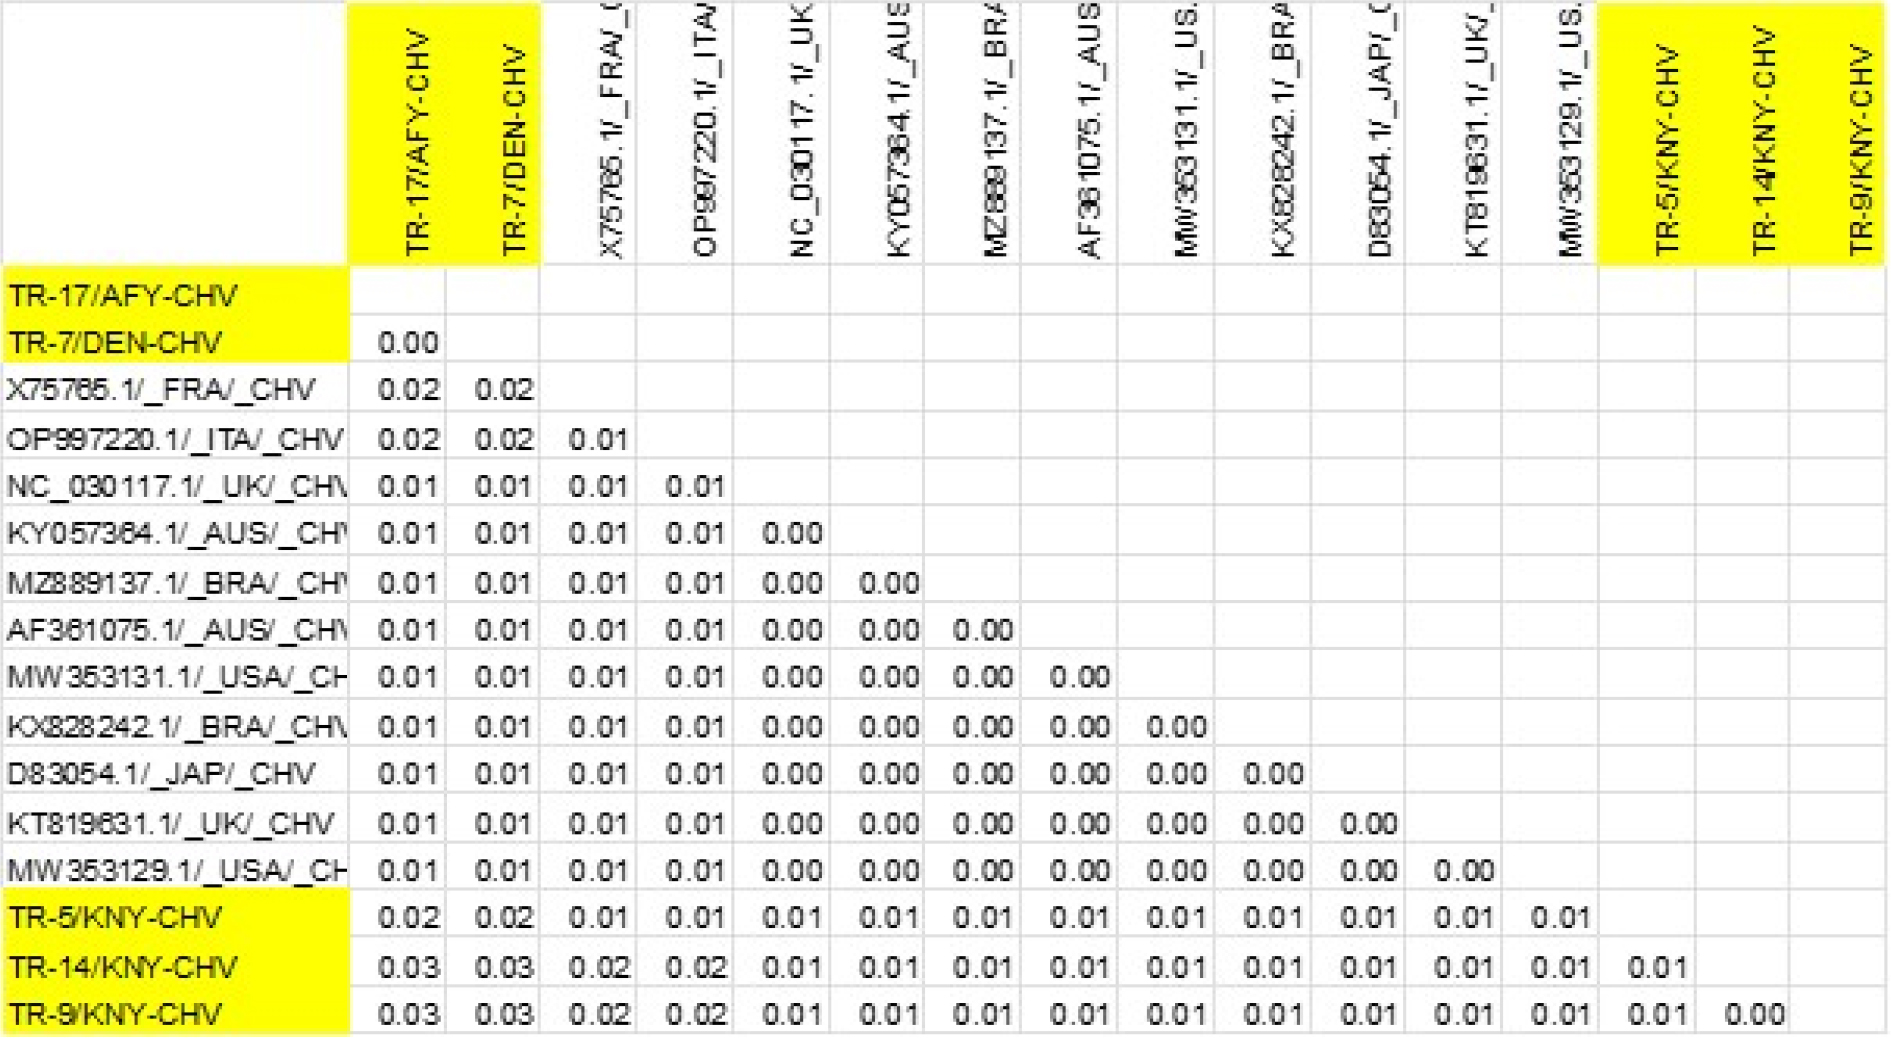
Fig. 8.
Results of genetic distance analysis of canine herpesvirus (CHV) sequences. TK-region sequences of CHV isolates were obtained from the NCBI BLAST database. Sequences obtained in the present research are highlighted in yellow
Table 1.
Distribution of pathogen positivity in terms of sample type
| Pathogen | Faeces | Swab | Total | |||||||||
|---|---|---|---|---|---|---|---|---|---|---|---|---|
| Positive | Negative | Positive | Negative | Positive | Negative | |||||||
| N | % | n | % | n | % | n | % | n | % | n | % | |
| Distemper virus | 0 | 0 | 93 | 100 | 4 | 11.8 | 30 | 88.2 | 4 | 3.1 | 123 | 96.9 |
| Statistical values: P-value < 0.05; χ2 = 11.297 | ||||||||||||
| Parvovirus | 56 | 60.2 | 37 | 39.8 | No analysis performed | 56 | 60.2 | 37 | 39.8 | |||
| Herpesvirus | No analysis performed | 5 | 14.7 | 29 | 85.3 | 5 | 14.7 | 29 | 85.3 | |||
Table 2.
Distribution of pathogen positivity in terms of sex
Table 3.
Distribution of pathogen positivity in terms of age
| Pathogen | Age | |||||||||||||||
|---|---|---|---|---|---|---|---|---|---|---|---|---|---|---|---|---|
| 0–12 months | 13–48 months | 49 months and older | Total | |||||||||||||
| Positive | Negative | Positive | Negative | Positive | Negative | Positive | Negative | |||||||||
| n | % | n | % | n | % | n | % | n | % | n | % | n | % | n | % | |
| Distemper virus* (Swab analysis**) | 1 | 0.8 | 56 | 44.1 | 2 | 1.6 | 37 | 29.1 | 1 | 0.8 | 30 | 23.6 | 4 | 3.1 | 123 | 96.9 |
| Parvovirus* (Faecal analysis**) | 28 | 30.1 | 16 | 17.2 | 15 | 16.1 | 12 | 12.9 | 13 | 14.0 | 9 | 9.7 | 56 | 60.2 | 37 | 39.8 |
| Herpesvirus* (Swab analysis**) | 2 | 5.9 | 11 | 32.4 | 3 | 8.8 | 9 | 26.5 | 0 | 0 | 9 | 26.5 | 5 | 14.7 | 29 | 85.3 |