
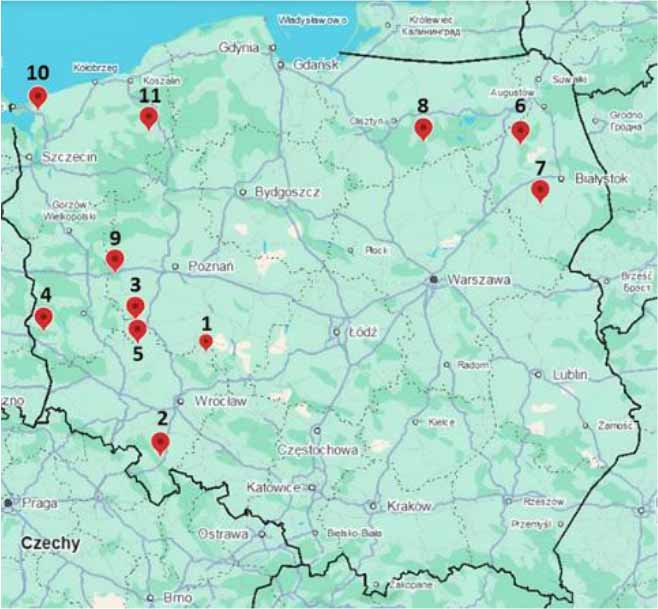
Fig. 1.
Map of 11 Culicoides sampling locations in Poland generated using Google Earth 10.81.0.1. The numbers correspond to those in Table 1
Table 1.
Summary of Culicoides midge collections by Polish county, including collection dates, total number of collected and proportion of blood-fed or post-blood-feeding individuals
| No. | County | Coordinates | Voivodeship | Collection start | Collection end | Total midges | % Blood-fed / Post-blood-feeding |
|---|---|---|---|---|---|---|---|
| 1 | Milicki | 51.55828 17.42570 | Dolnośląskie | 10/09/2024 | 25/11/2024 | 1,874 | 75.7 |
| 2 | Ząbkowicki | 50.54168 16.73937 | Dolnośląskie | 09/09/2024 | 28/10/2024 | 719 | 65.8 |
| 3 | Wschowski | 51.84626 16.32727 | Lubuskie | 17/09/2024 | 28/10/2024 | 120 | 22.2 |
| 4 | Żarski | 51.71833 14.90194 | Lubuskie | 11/09/2024 | 25/11/2024 | 1,467 | 39.8 |
| 5 | Sieradzki | 51.62588 16.36884 | Łódzkie | 11/09/2024 | 29/10/2024 | 311 | 50.4 |
| 6 | Augustowski | 53.45298 22.54266 | Podlaskie | 13/09/2024 | 12/11/2024 | 1,636 | 47.7 |
| 7 | Białostocki | 52.86790 22.79496 | Podlaskie | 13/09/2024 | 22/11/2024 | 176 | 90.9 |
| 8 | Szczycieński | 53.52915 20.95410 | Warmińsko-Mazurskie | 16/09/2024 | 25/11/2024 | 4,480 | 67.2 |
| 9 | Nowotomyski | 52.29694 15.99486 | Wielkopolskie | 10/092024 | 21/11/2024 | 920 | 69.5 |
| 10 | Kamieński | 53.84892 14.66862 | Zachodnio-Pomorskie | 12/09/2024 | 27/10/2024 | 707 | 37.0 |
| 11 | Szczecinecki | 53.67671 16.49079 | Zachodnio-Pomorskie | 12/09/2024 | 29/11/2024 | 606 | 64.4 |
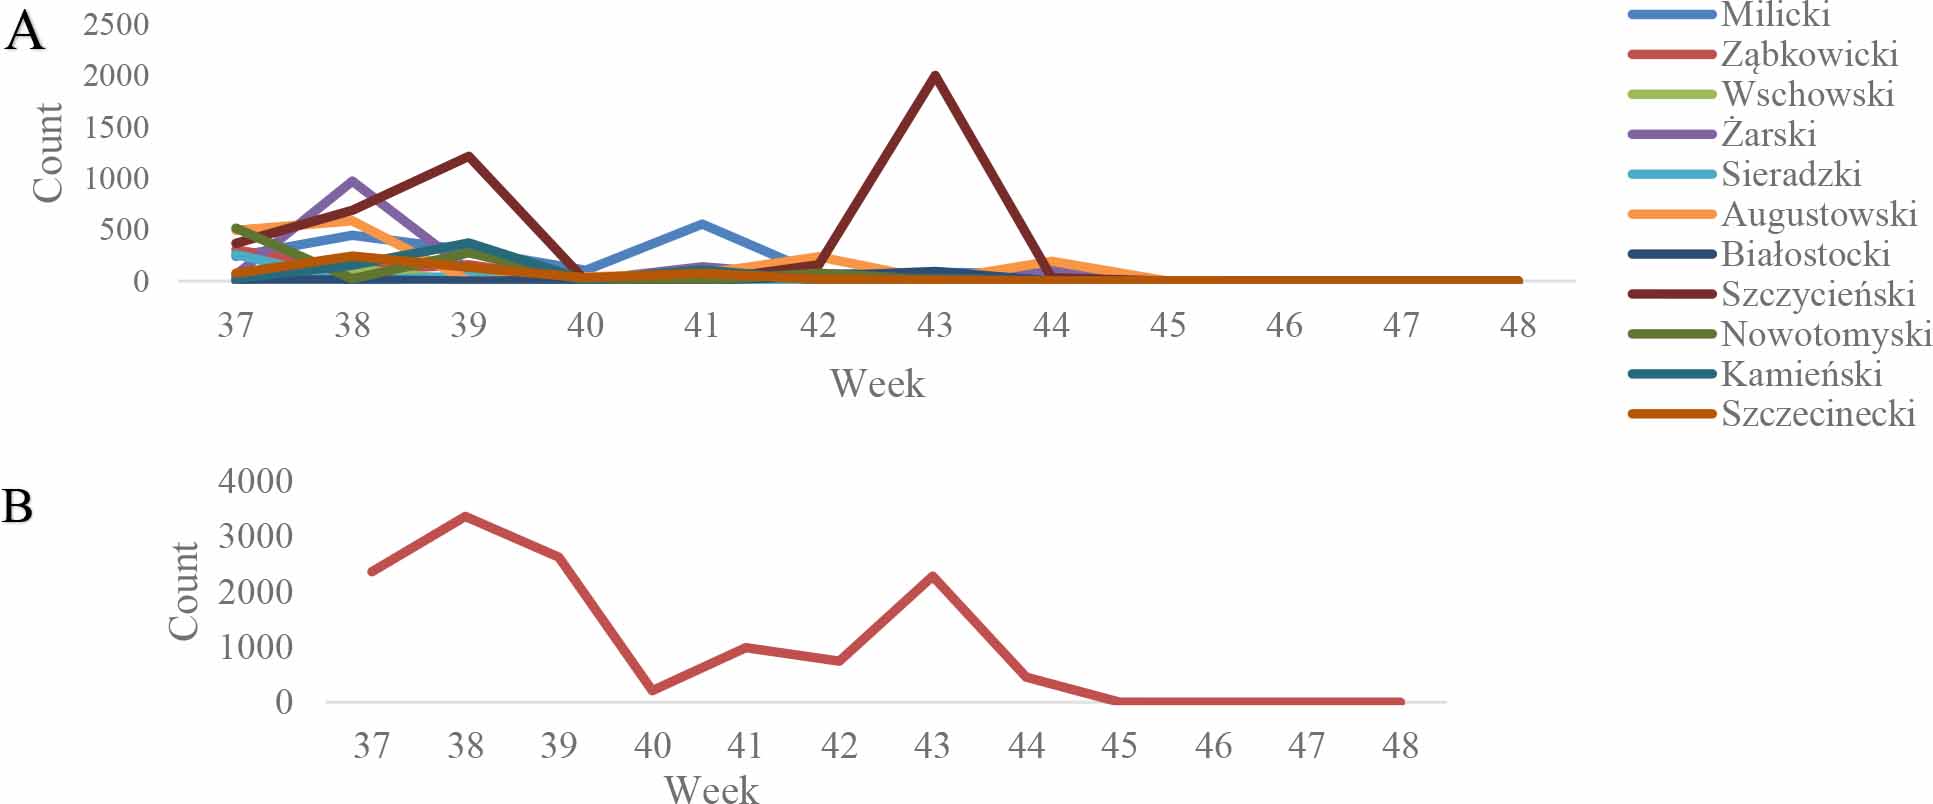
Fig 2.
A - Temporal dynamics of Culicoides abundance across 11 trapping sites in Poland. Individual trapping locations are differentiated by colour; B - Graph of the dynamic of Culicoides numbers trappe
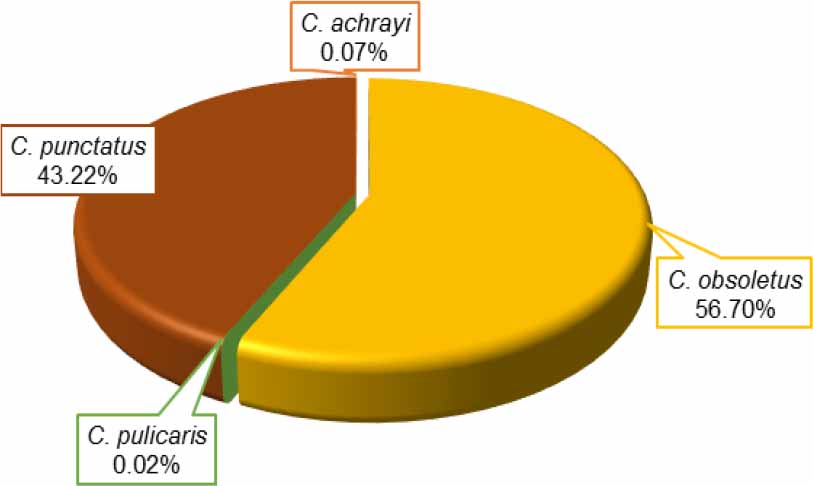
Fig. 3.
Pie chart showing the species composition of Culicoides specimens collected during trapping conducted from 9 September to 29 November at 11 sites in Poland
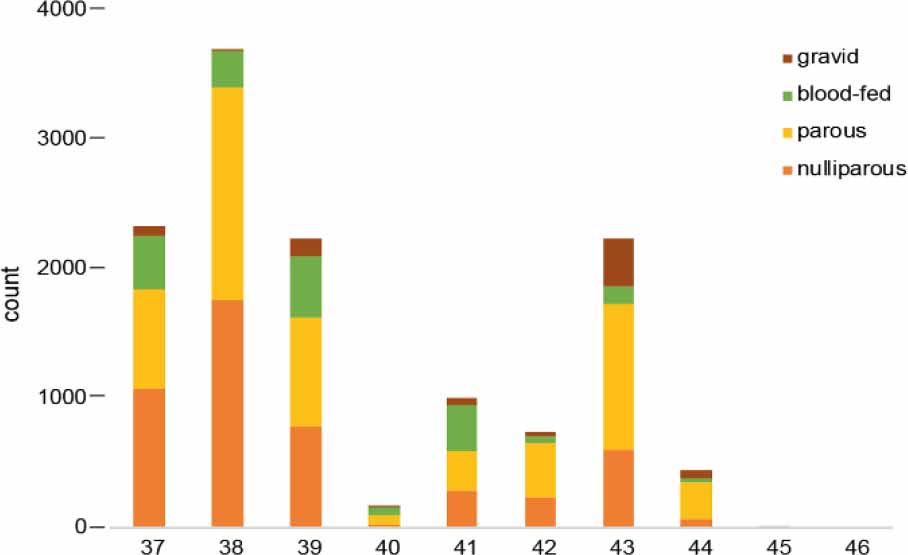
Fig. 4.
Gonotrophic structure of Culicoides populations captured weekly in 2024, showing the number of nulliparous, parous, blood-fed and gravid females