
Table 1.
Bovine leukaemia virus (BLV) proviral load in peripheral blood leukocytes (PBLs) and organs of naturally infected cattle
| Carcass No. | BLV proviral load – number of copies per 106 cells | |||
|---|---|---|---|---|
| PBLs | muscles | spleens | lymph nodes | |
| 1 | 85,803 | 119* | 59,188 | 881 |
| 2 | 57,284 | 114* | 58,883 | 6,888 |
| 3 | 54,556 | 14** | 9,559 | 1,419 |
| 4 | 38,228 | 51* | 645 | 278 |
| 5 | 14,895 | 19* | 3 | 287 |
| 6 | 11,019 | 13* | 3,215 | 54 |
| 7 | 8,603 | 20* | 314 | 14 |
| 8 | 7,323 | 35* | 3,231 | 85 |
| 9 | 5,330 | 4* | 2,295 | 24 |
| 10 | 2,211 | 0* | 45 | 111 |
| 11 | 269 | 31* | 37 | 96 |
| 12 | 187 | 2* | 1 | 0 |
| 13 | 182 | 0* | 0 | 0 |
| 14 | 25 | 0* | 48 | 6 |
| 15 | 16 | 0* | 17 | 2 |
| 16 | 11 | 8*** | 0 | 8 |
| 17 | 11 | 0* | 2 | 0 |
| 18 | 4 | 0* | 4,137 | 0 |
| 19 | 3 | 4*** | 8 | 0 |
| 20 | 3 | 4* | 1 | 0 |
| 21 | 3 | 1* | 0 | 4 |
| 22 | 1 | 4* | 0 | 0 |
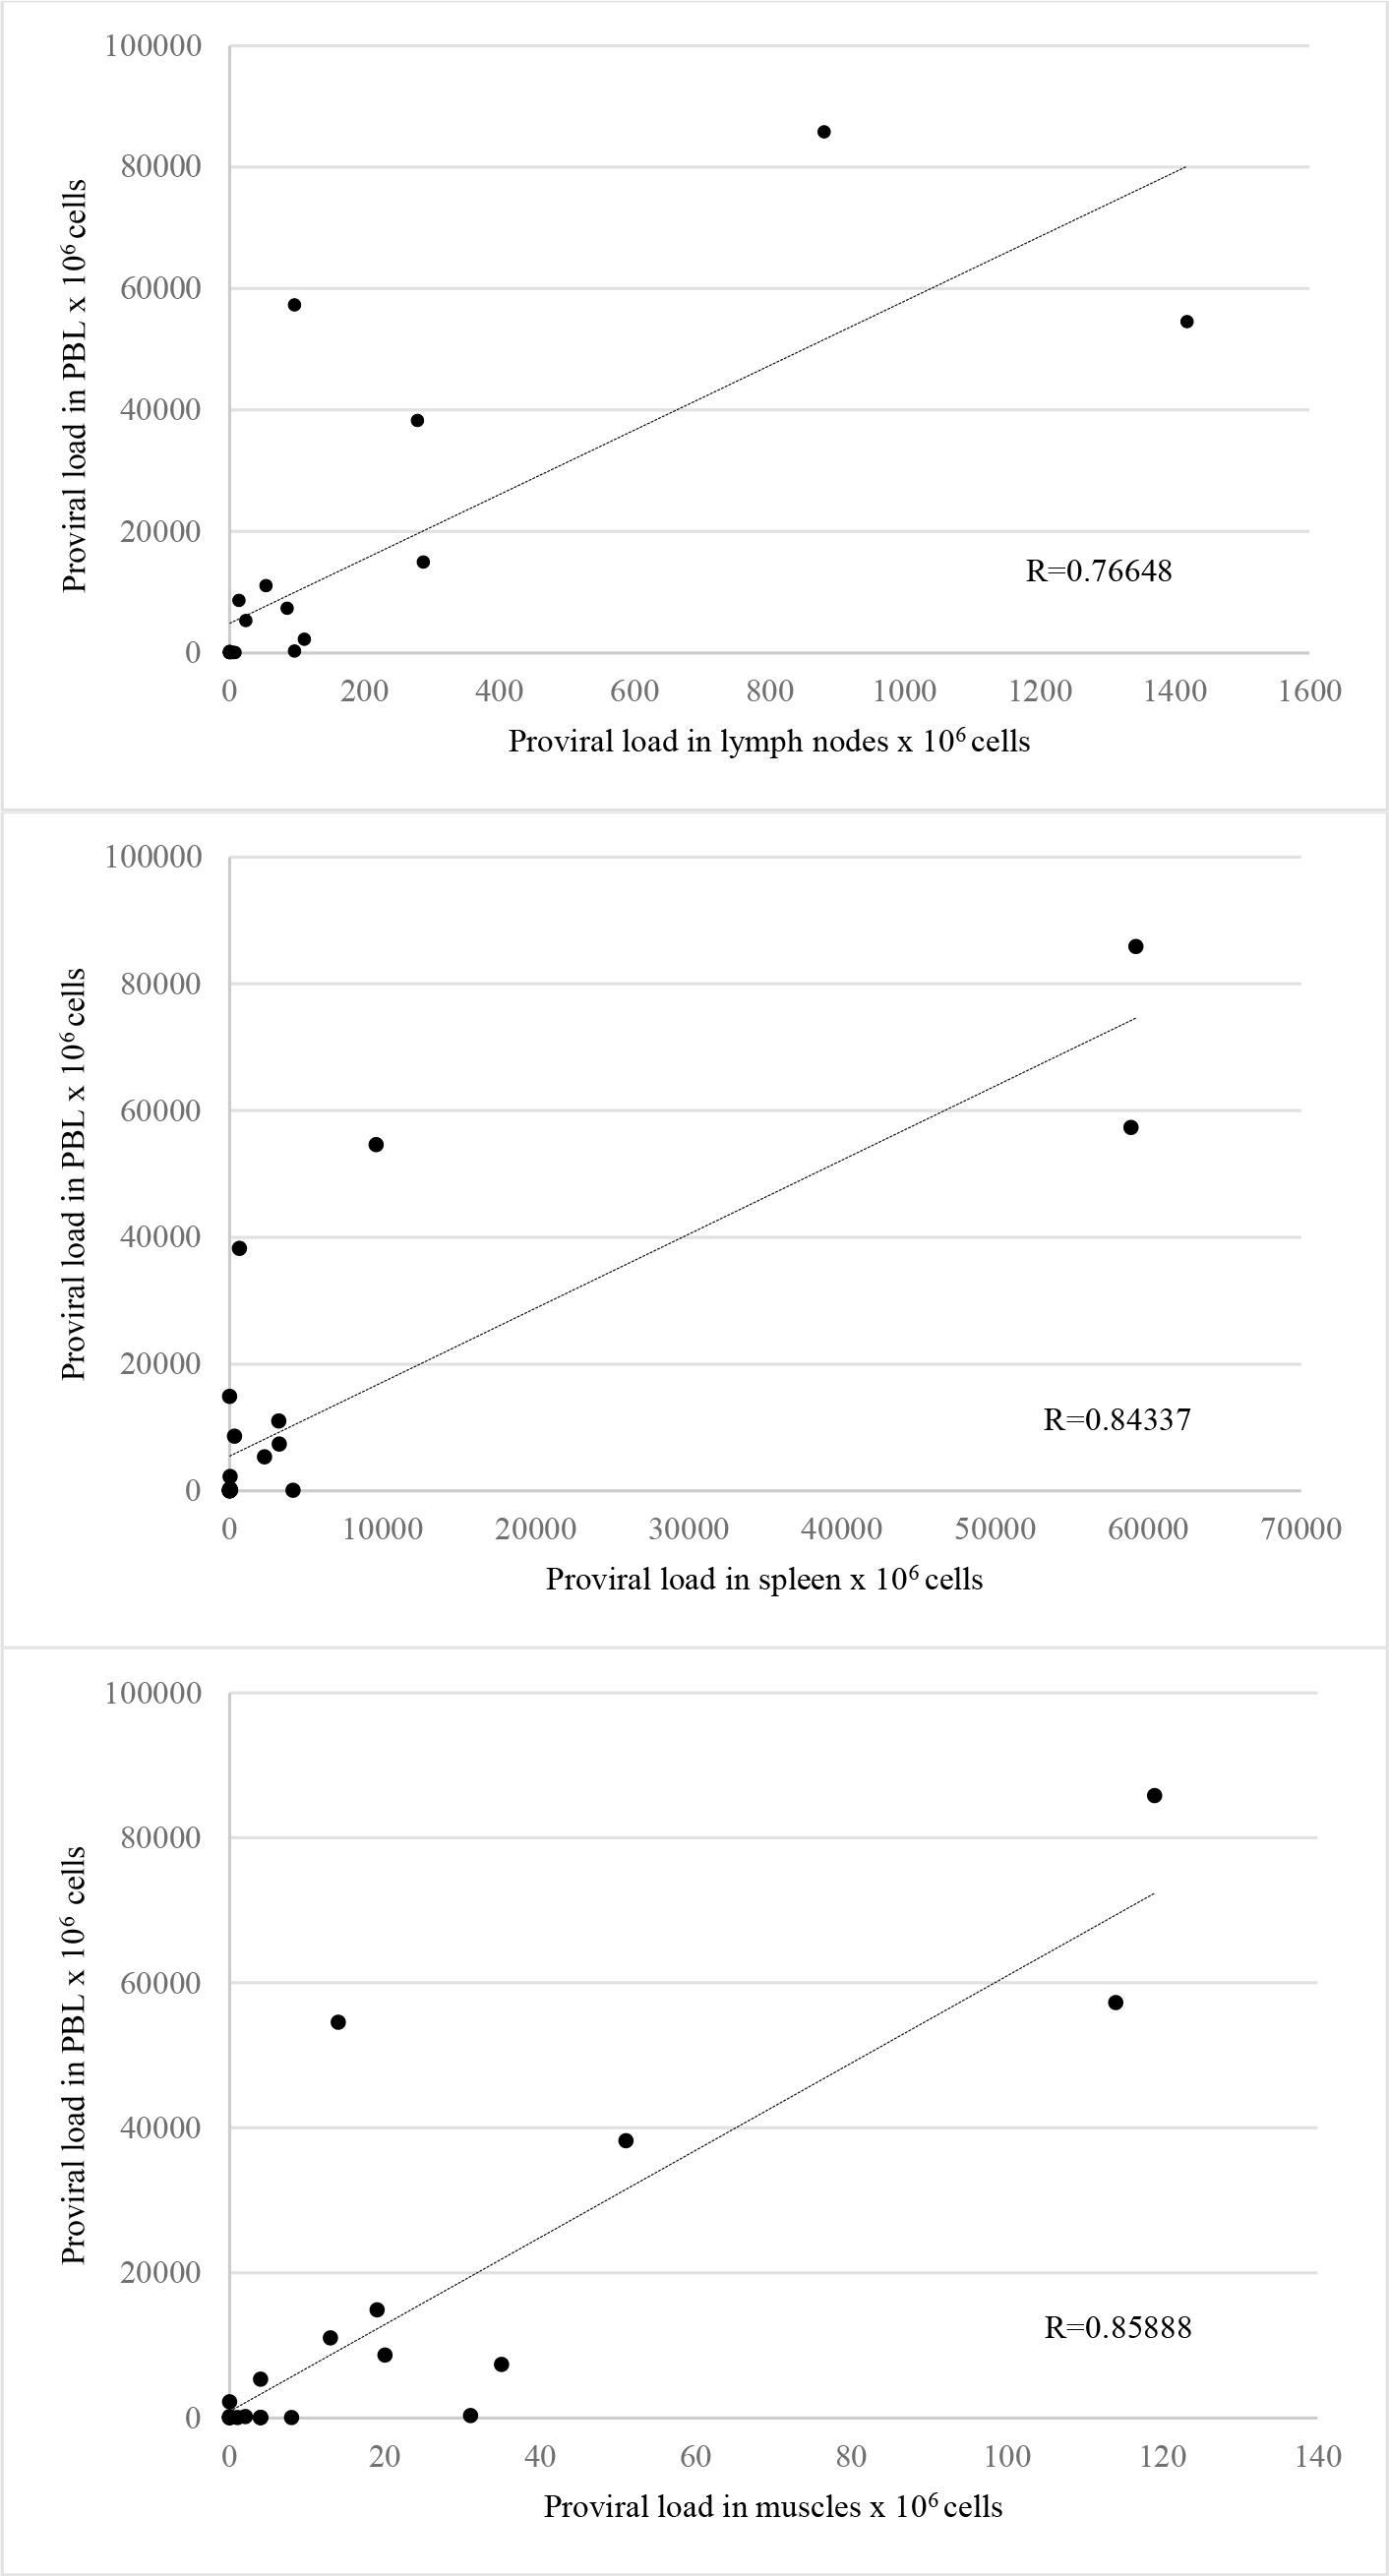
Fig. 1.
Correlations between peripheral blood leukocyte (PBL) bovine leukaemia virus proviral load (PVL) and the PVL in the examined lymph nodes, muscles and spleens. The BLV PVL is expressed as number of copies of proviral DNA per 106 cells