
Fig. 1.
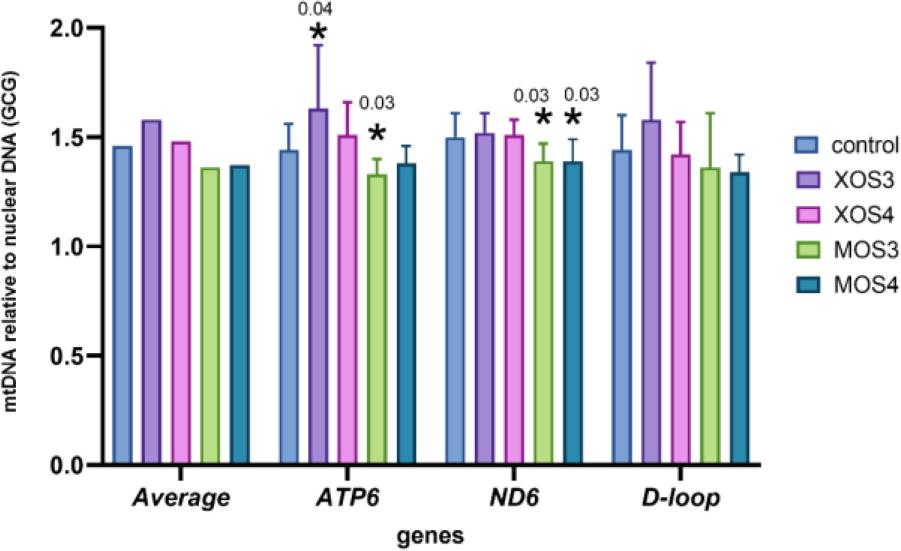
Fig. 2.
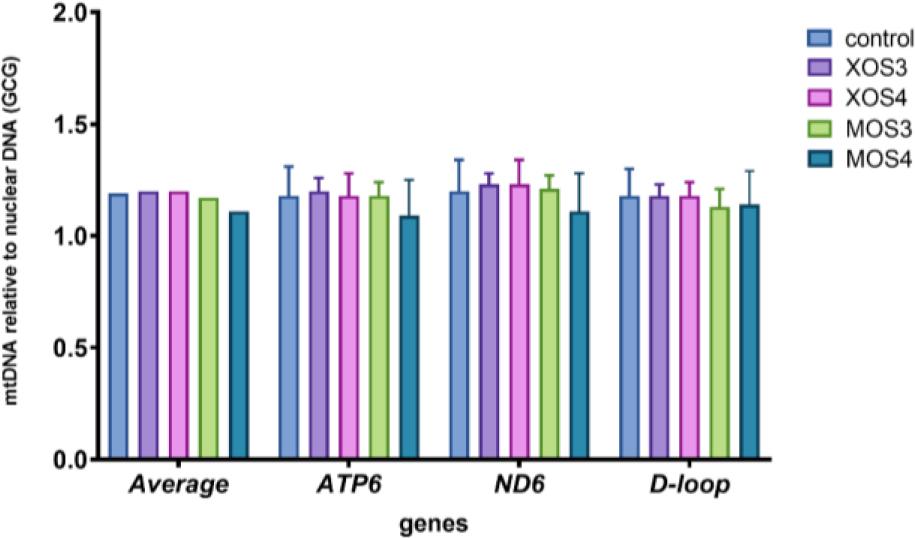
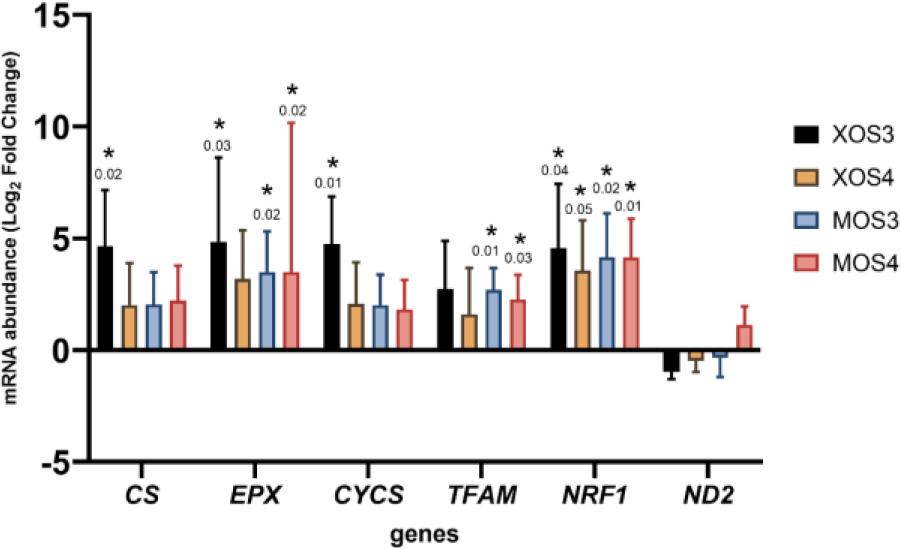
Fig. 3.
Fig. 4.
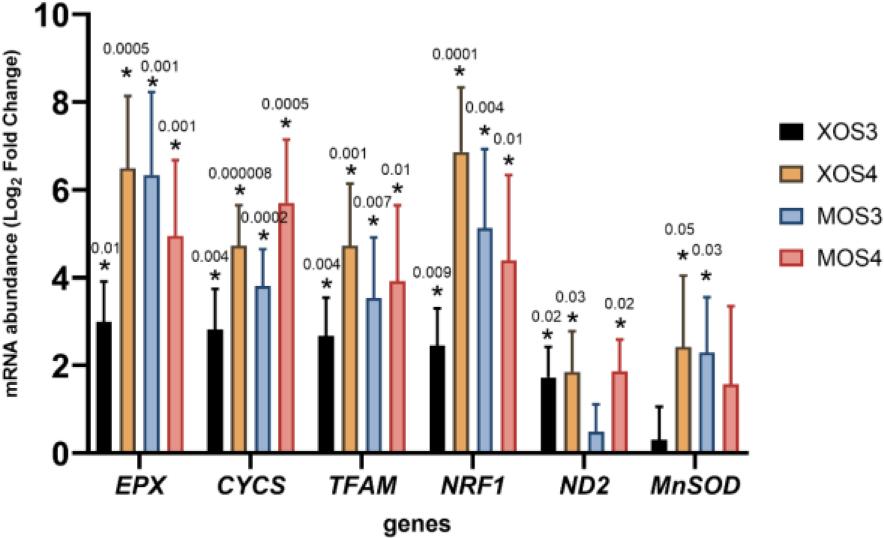
Fig. 5.
Physicochemical features of the pectoral muscles of broilers given early host-supporting prebiotic therapy
| Group | SEM | P-value | ||||||
|---|---|---|---|---|---|---|---|---|
| Control | XOS3 | XOS4 | MOS3 | MOS4 | ||||
| Pectoral muscle (g) | 533.40 | 505.04 | 482.34 | 483.70 | 471.96 | 8.660 | 0.170 | |
| pH24hours | 5.94 | 6.06 | 6.05 | 6.03 | 6.03 | 0.010 | 0.119 | |
| Colour | L* | 50.48 | 51.08 | 50.02 | 49.38 | 50.33 | 0,320 | 0.578 |
| a* | 2.88 | 2.79 | 3.02 | 2.56 | 3.00 | 0,170 | 0.923 | |
| b* | 5.38 | 4.44 | 4.61 | 4.12 | 5.27 | 0,200 | 0.203 | |
| Drip loss (%) | 1.35 | 1.56 | 1.34 | 1.28 | 1.65 | 0.060 | 0.191 | |
| Water-holding capacity (%) | 30.39b | 32.40b | 39.55a | 32.41b | 34.70ab | 0.840 | 0.004 | |
Primer sequences used in the quantitative PCR with initial reverse transcription to analyse mitochondrial gene expression in broilers given early host-supporting prebiotic therapy
| Gene | Full name | NCBI gene ID | Primer sequence (5ʹ→3ʹ) |
|---|---|---|---|
| CS | Citrate synthase | 100858903 | F: GCATTTTCCAAGGGTGAGCC |
| EPX (MPO) | Eosinophil peroxidase | 417467 | F: AAGCAACTTCTGCAGGACTGA |
| CYCS | Cytochrome c | 420624 | F: CCATGAAGGTTGGGTCCAGT |
| TFAM | Transcription factor a, mitochondrial | 373888 | F: CCTACGAGAGGGGAGGGG |
| NRF1 | Nuclear respiratory factor 1 | 416677 | F: AAAAGCCCAGAGCTGAATGGT |
| ND2 | NADH dehydrogenase subunit 2 | 63549482 | F: ATCAGCCCTAATCCTCTTCTC |
| MnSOD (SOD2) | Superoxide dismutase 2, mitochondrial | 374042 | F: GCAGCCTGTGCAAATCAAGA |