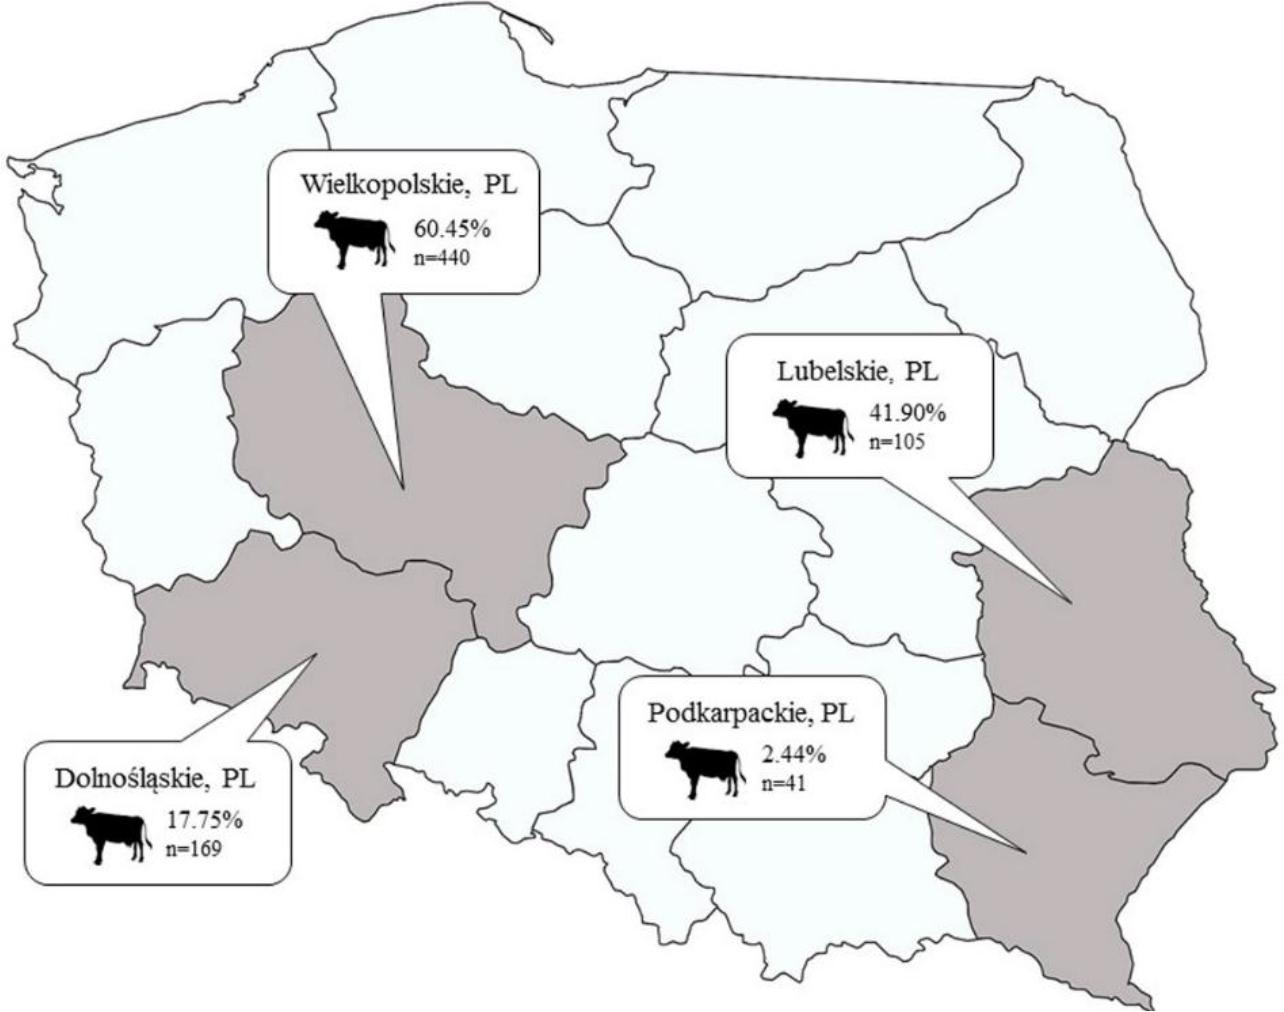
Have a personal or library account? Click to login
Serological evidence of influenza D virus circulation among cattle in Poland Cover

Serological evidence of influenza D virus circulation among cattle in Poland

Open Access
|Sep 2025

Figures & Tables

Fig. 1.

Voivodeship map of Poland. Grey shading indicates the regions of origin of cattle tested for anti–influenza D virus antibodies. The number of cattle tested and corresponding seroprevalence are provided for each region

Fig. 2.

Scatter plots of influenza D virus antibody titres obtained by haemagglutination inhibition (HI) assay and virus neutralisation (VN) test. The positive slope (1.6558) suggests that an increase in HI titre was associated with a corresponding increase in VN titre

Fig. 3.

Box plot diagrams of the distribution of haemagglutinin inhibition (HI) and virus neutralisation (VN) titres in three age groups of cattle (A) and with regard to the origin of the animals tested (B); only positive HI and VN titres were considered. The whiskers are the 25th and 75th quartiles. The lines across the middle of the boxes identify the median values of titres

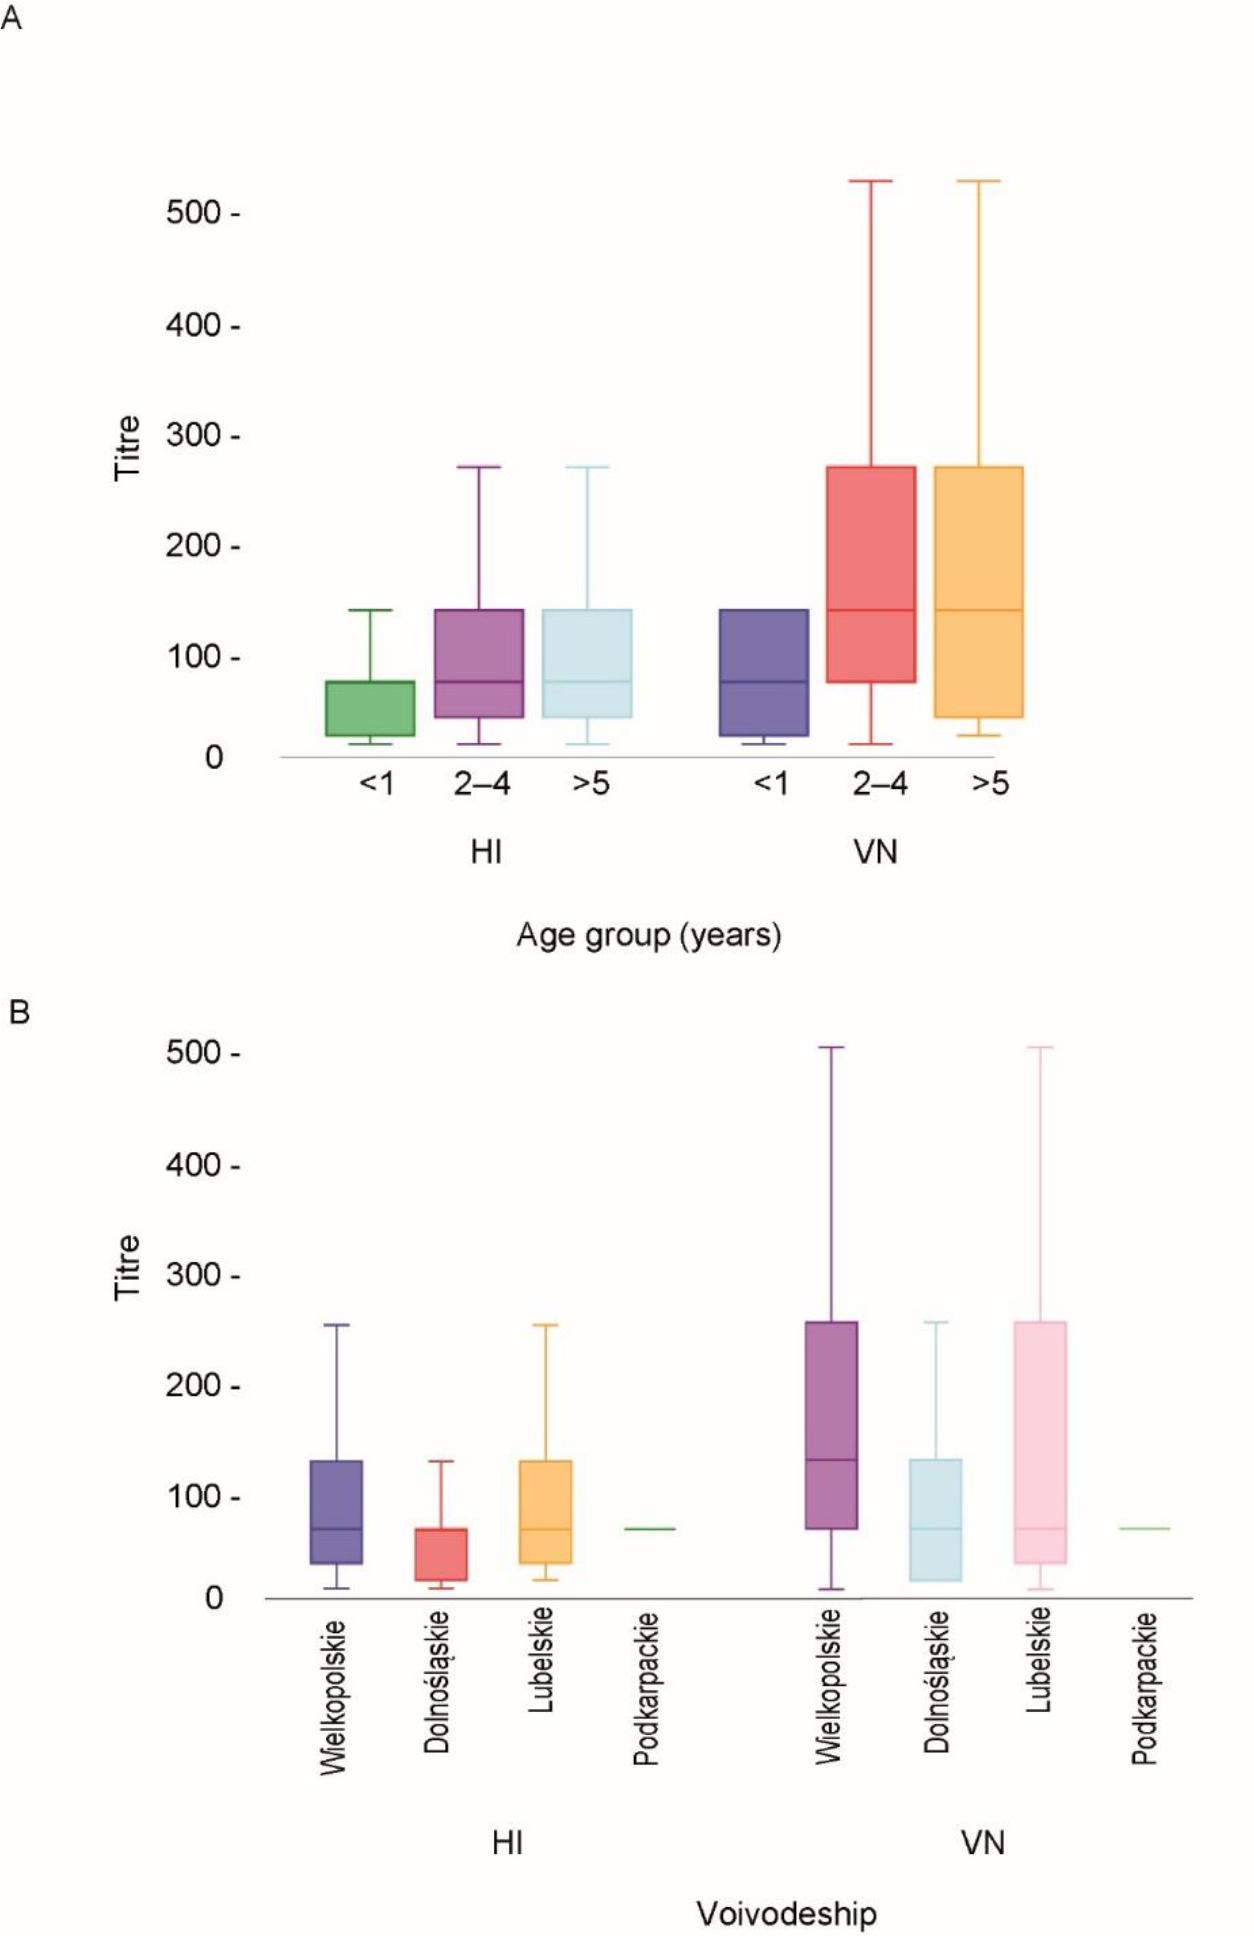
Analysis of influenza D virus seroprevalence in relation to cattle age, sex and voivodeship of origin

VariableSeroprevalence in cattle in haemagglutination inhibition assay
n/N1% (95% CI2)Chi-squaredP-value
Age group
Calves (≤1 year old)11/9811.2 (5.7–19.2)55.2<0.001
young adults 2–4 years old)202/38153.0 (47.9–58.1)
older adults (≥5 years old)128/27646.4 (40.4–52.4)
Sex
female71/28325.1 (20.1–30.6)2.5<0.1
male4/3212.5 (3.5–29.0)
missing data266/44060.4 (55.7–65.0)
Voivodeship
Dolnośląskie30/16917.8 (12.3–24.3)123.5<0.001
Lubelskie44/10541.9 (32.2–51.9)
Podkarpackie1/412.4 (0.1–12.8)
Wielkopolskie266/44060.4 (55.7–65.0)
Language: English
Page range: 305 - 311
Submitted on: Apr 25, 2025
Accepted on: Sep 8, 2025
Published on: Sep 9, 2025
Published by: National Veterinary Research Institute in Pulawy
In partnership with: Paradigm Publishing Services
Publication frequency: 4 times per year

© 2025 Małgorzata Kwaśnik, Jerzy Rola, Magdalena Larska, Wojciech Rożek, published by National Veterinary Research Institute in Pulawy
This work is licensed under the Creative Commons Attribution 4.0 License.