
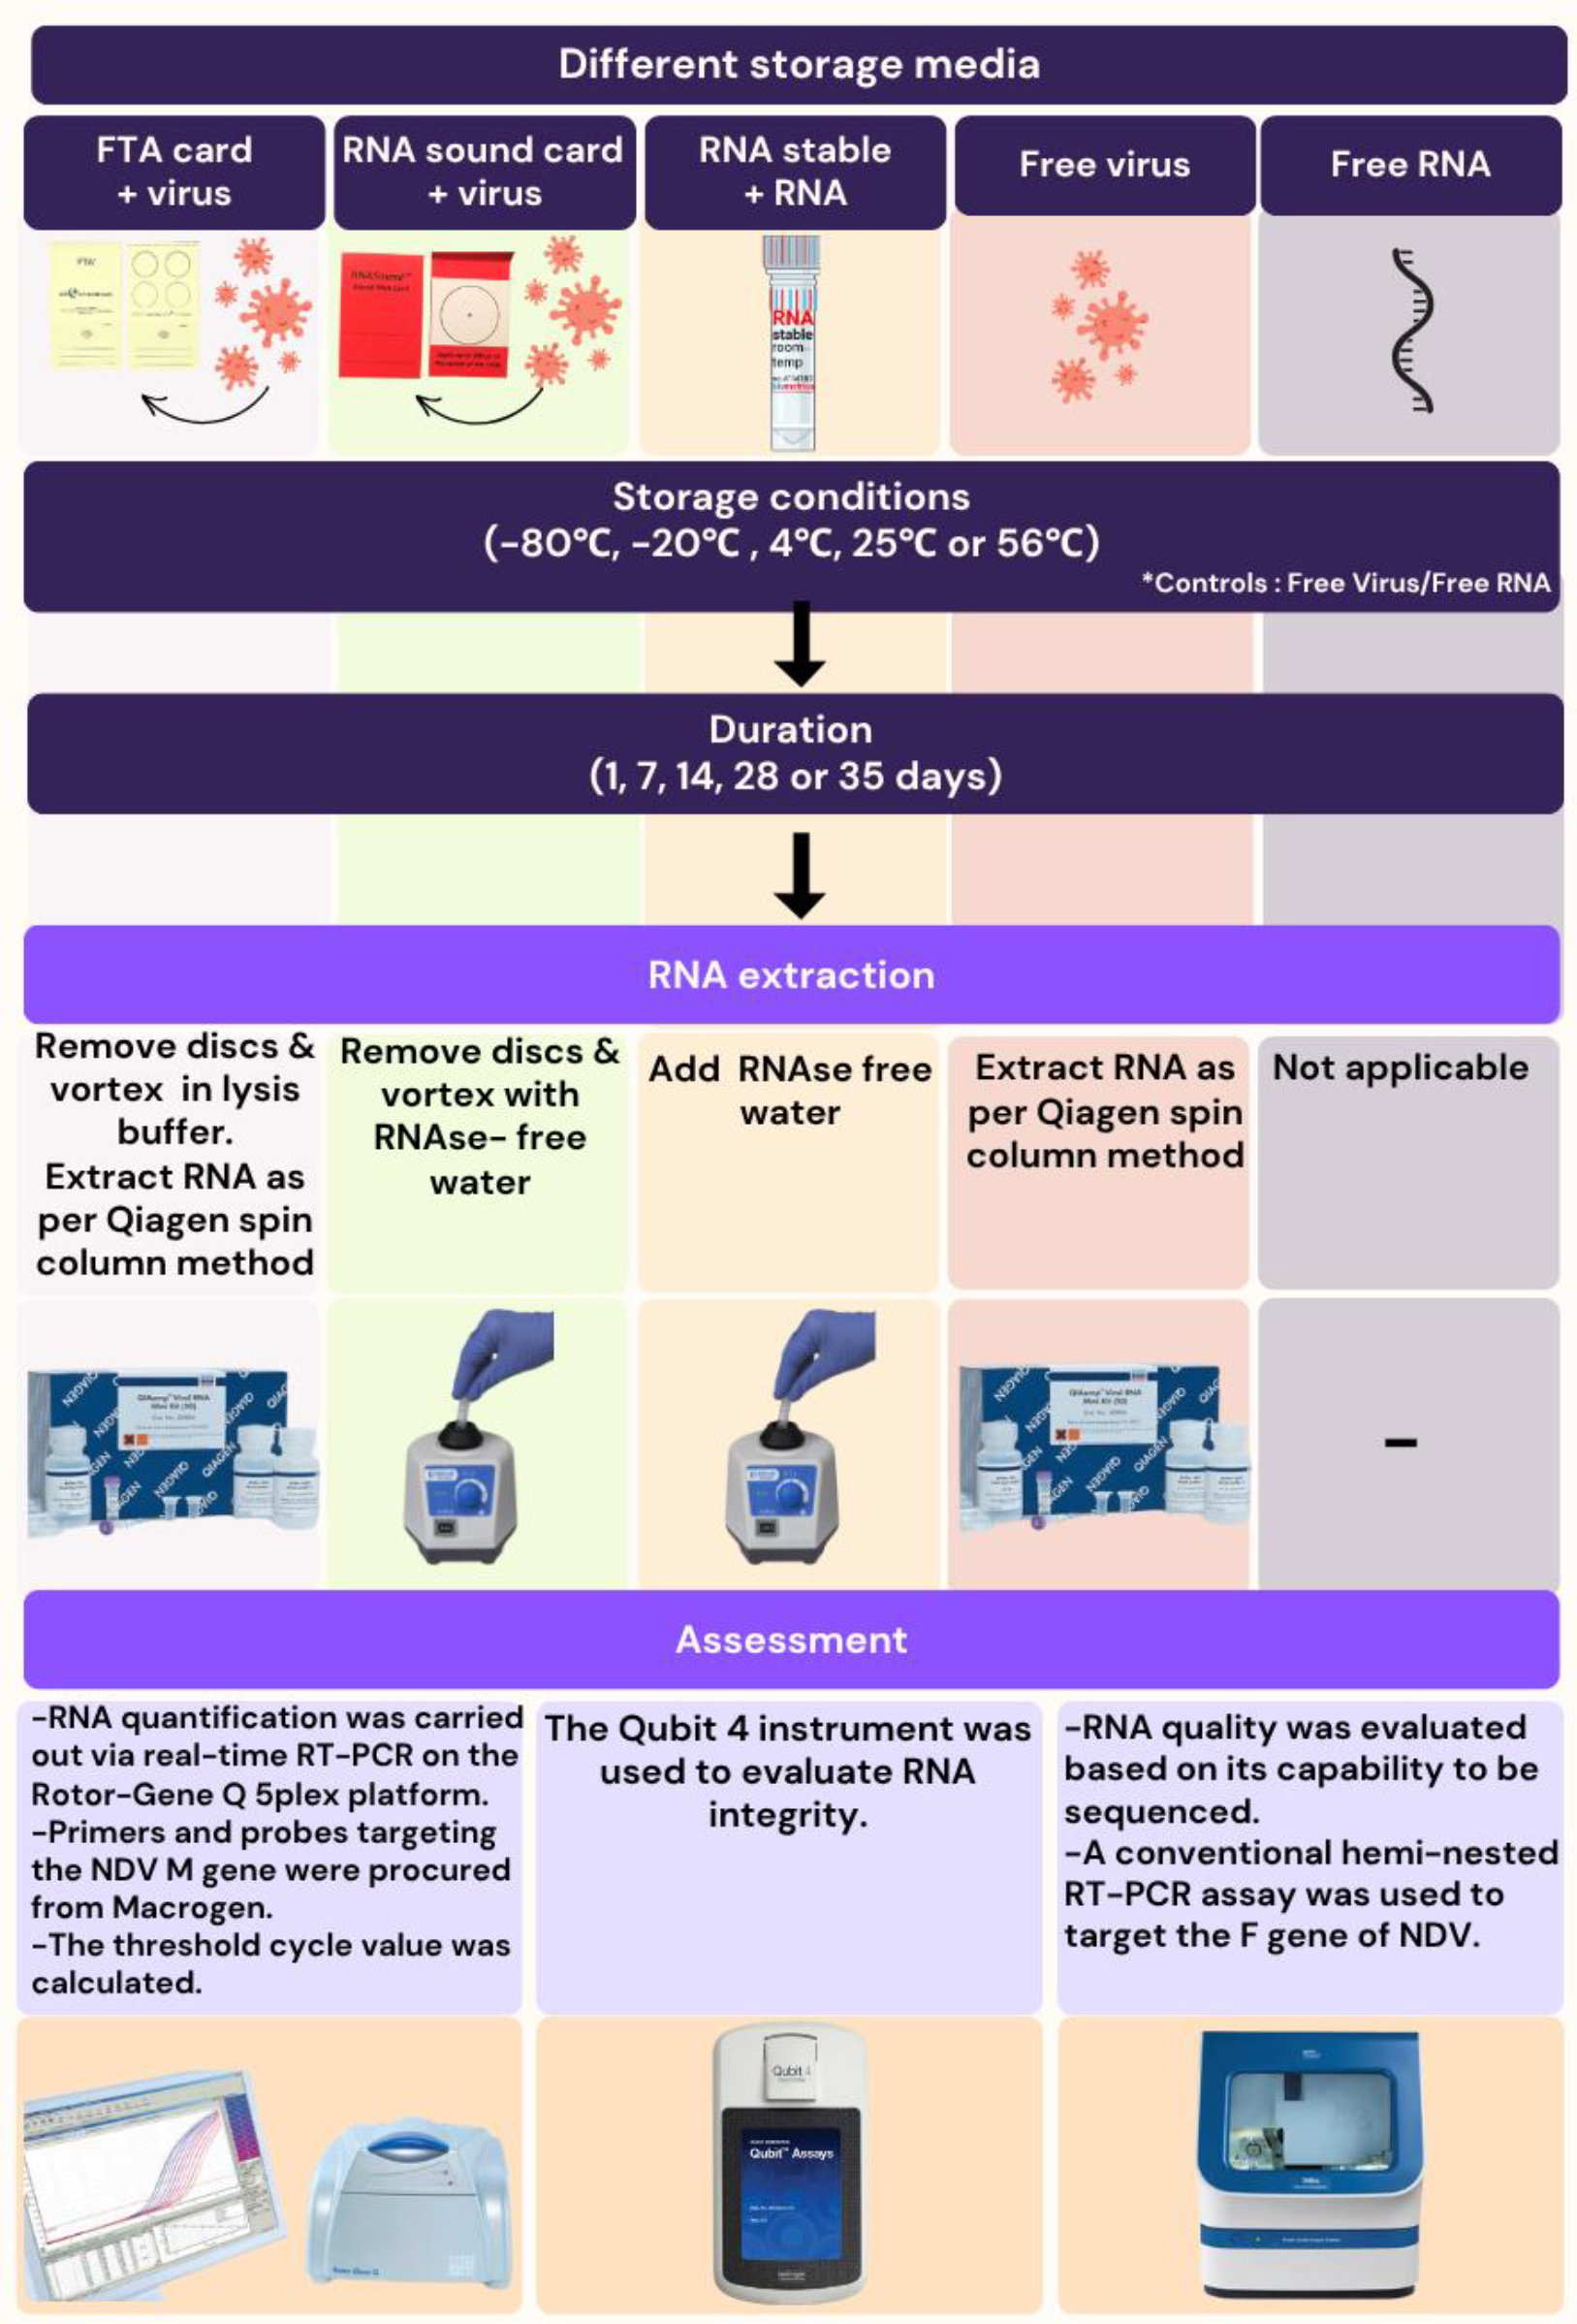
Fig. 1.
Study methodology. Newcastle disease virus (NDV) RNA preservation using various methods (Flinders Technology Associates (FTA) cards, RNASound cards and RNAstable tubes) across temperatures (–80°C, –20°C, 4°C, 25°C and 56°C) and incubation periods (1, 7, 14, 28 and 35 d). The quality of RNA was assessed using real-time reverse-transcription (RT)-PCR, ratiometric fluorometry and Sanger sequencing
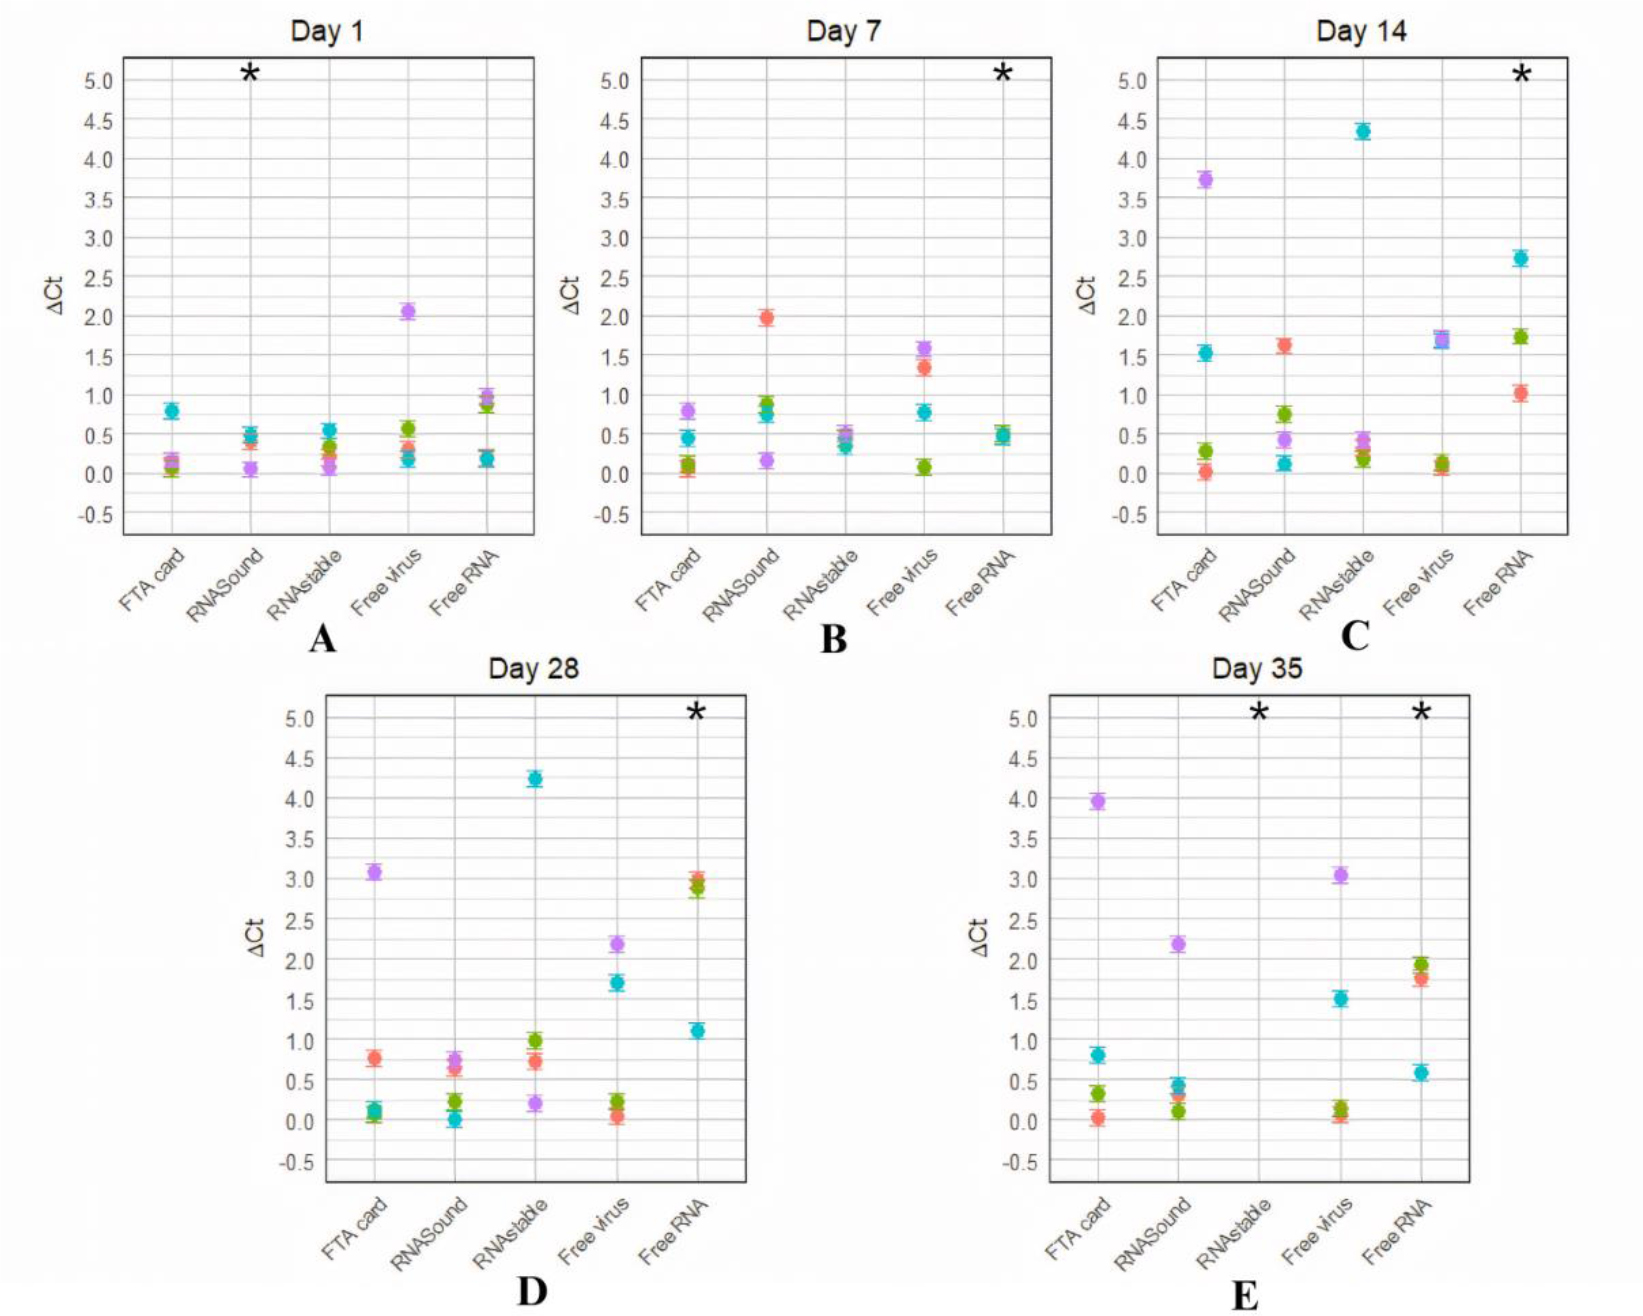
Fig. 2.
Values of Δ threshold cycle (ΔCt) for Newcastle virus RNA samples preserved with Flinders Technology Associates (FTA) cards, RNASound cards and RNAstable tubes or not preserved as free virus and free RNA controls and incubated at –20°C, 4°C, 25°C and 56°C; ΔCts are compared to those of RNA samples stored at –80°C. A – day 1; B – day 7; C – day 14; D – day 28; E – day 35; * – excluded datum or undetectable amplification
Table 1.
Newcastle virus RNA integrity data for various preservation methods and controls at three temperatures across three time points. The integrity of RNA was scored in a range from 1 to 10, where 10 was the highest integrity
| Temperature (°C) | FTA cards | RNASound cards | RNAstable tubes | Free virus | Free RNA | |
|---|---|---|---|---|---|---|
| –80 | 10 | N.D. | 9.1 | 9.4 | 8.7 | |
| Day 1 | 25 | 10 | N.D. | N.D. | 9.0 | 9.5 |
| 56 | 10 | N.D. | N.D. | 8.5 | 7.9 | |
| –80 | 10 | N.D. | 9.1 | 9.3 | 8.6 | |
| Day 14 | 25 | 10 | N.D. | N.D. | 8.9 | 9.5 |
| 56 | 10 | N.D. | N.D. | 8.3 | 7.4 | |
| –80 | 10 | N.D. | 9.2 | 8.6 | 8.6 | |
| Day 35 | 25 | 10 | N.D. | N.D. | 8.9 | 9.4 |
| 56 | 10 | N.D. | N.D. | 8.2 | 7.2 |
Table 2.
Reference sequence to partial F gene sequence match results after Newcastle virus RNA preservation as free virus and free RNA and by Flinders Technology Associates (FTA) card, RNASound and RNAstable
| Free virus | FTA cards | RNASound cards | Free RNA | RNAstable tubes | ||||||
|---|---|---|---|---|---|---|---|---|---|---|
| Sample number | Treatment (°C)/days | Sample number | Treatment (°C)/days | Sample number | Treatment (°C)/days | Sample number | Treatment (°C)/days | Sample number | Treatment (°C)/days | |
| 1 | –80/1 | 10 | –80/1 | 19 | –80/1 | 28 | –80/1 | 37 | –80/1 | |
| 7 | –80/35 | 11 | 25/1 | 20 | 25/1 | 29 | 25/1 | 38 | 25/1 | |
| 8 | 25/35 | 12 | 56/1 | 21 | 56/1 | 30 | 56/1 | 39 | 56/1 | |
| - | - | 14 | 25/28 | 22 | –80/28 | 31 | –80/28 | 40 | –80/28 | |
| - | - | 15 | 56/28 | 24 | 56/28 | 32 | 25/28 | 41 | 25/28 | |
| - | - | 16 | –80/35 | 26 | 25/35 | 34 | –80/35 | 42 | 56/28 | |
| - | - | 17 | 25/35 | 27 | 56/35 | 35 | 25/35 | 43 | –80/35 | |
| - | - | - | - | - | - | - | - | 44 | 25/35 | |
| - | - | - | - | - | - | - | - | 45 | 56/35 | |
| Matching samples/total samples | - | 3/9 | - | 7/9 | - | 7/9 | - | 7/9 | - | 9/9 |