
Fig. 1.
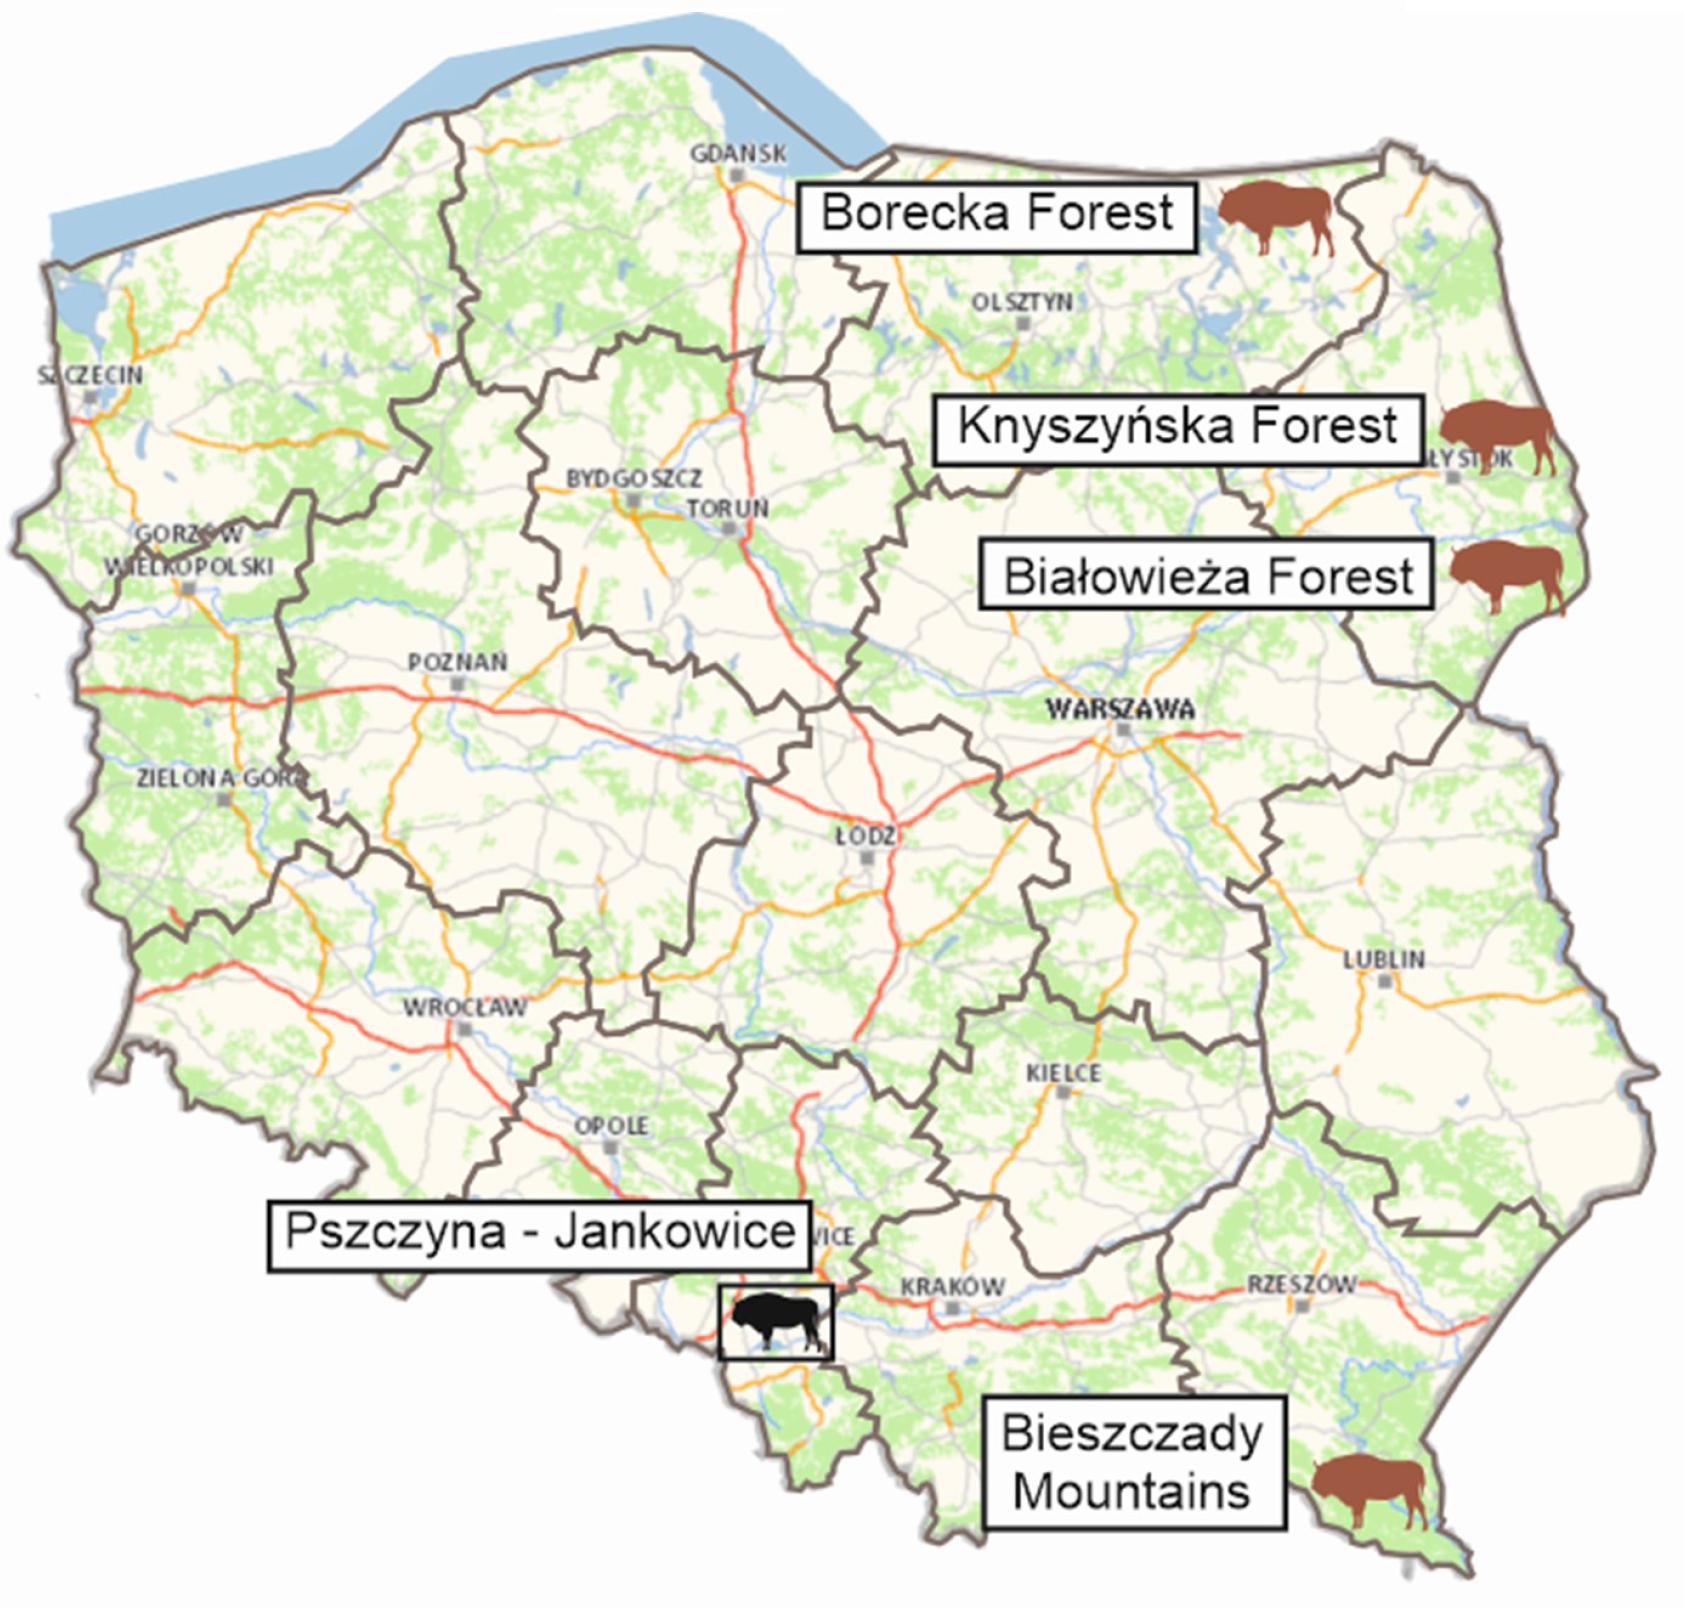
Fig. 2.
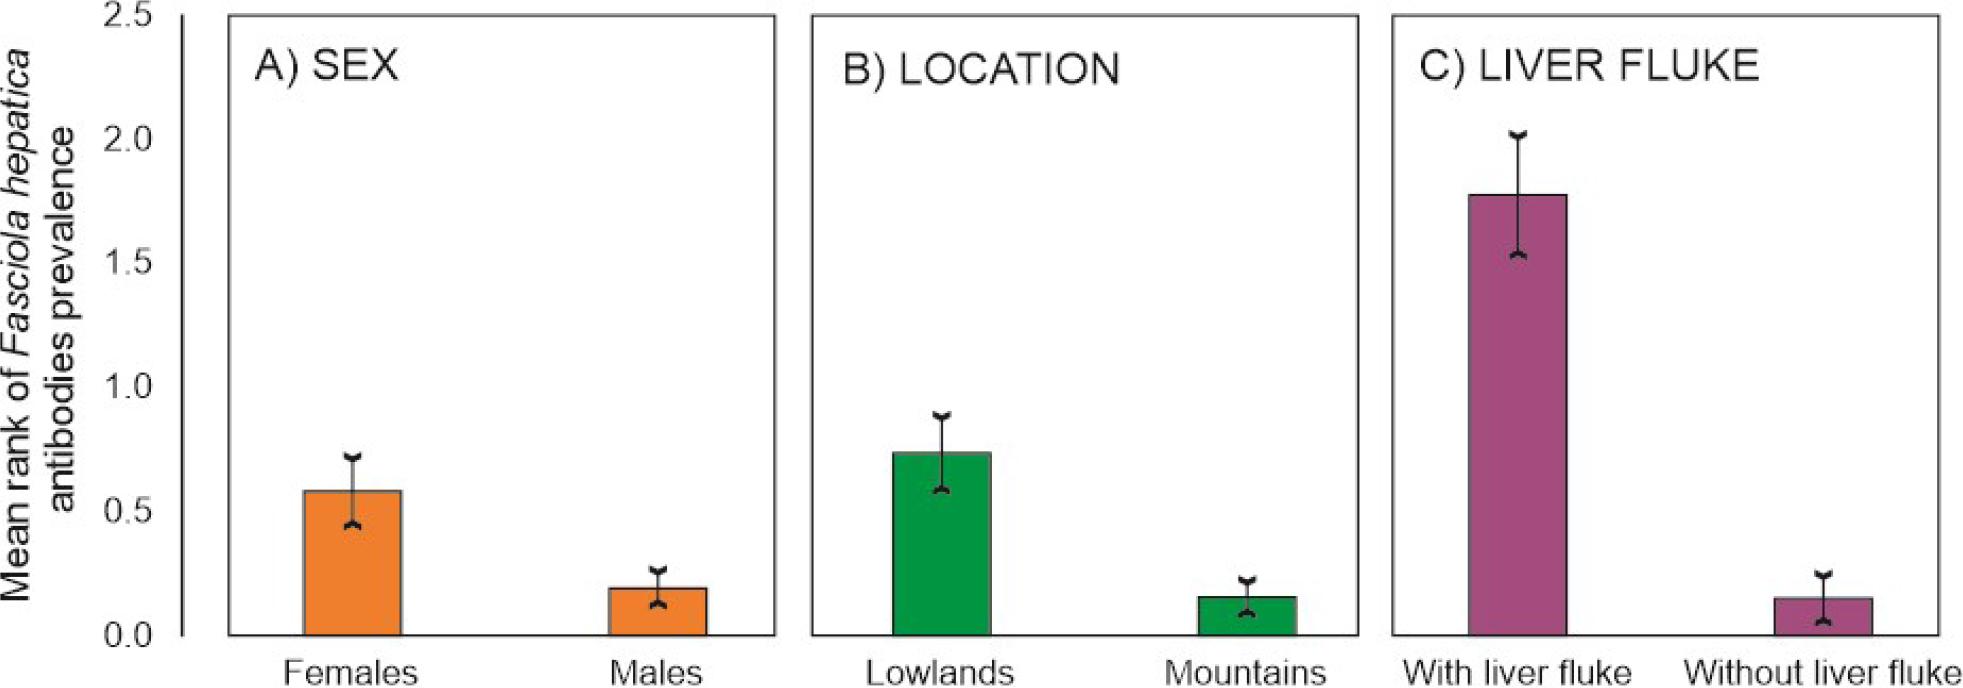
Effect of sex and site on Fasciola hepatica seropositivity in European bison_ The age variable was excluded in the model selection procedure
| B | SE | Lower CI | Upper CI | Wald chi2 | P-value | |
|---|---|---|---|---|---|---|
| Intercept | –2.392 | 0.3611 | –3.099 | –1.684 | 43.872 | <0.001 |
| Female | 1.090 | 0.3087 | 0.485 | 1.695 | 12.462 | <0.001 |
| Male | 0* | |||||
| Lowland location | 1.544 | 0.3433 | 0.872 | 2.217 | 20.243 | <0.001 |
| Mountain location | 0* |