
Fig. 1.
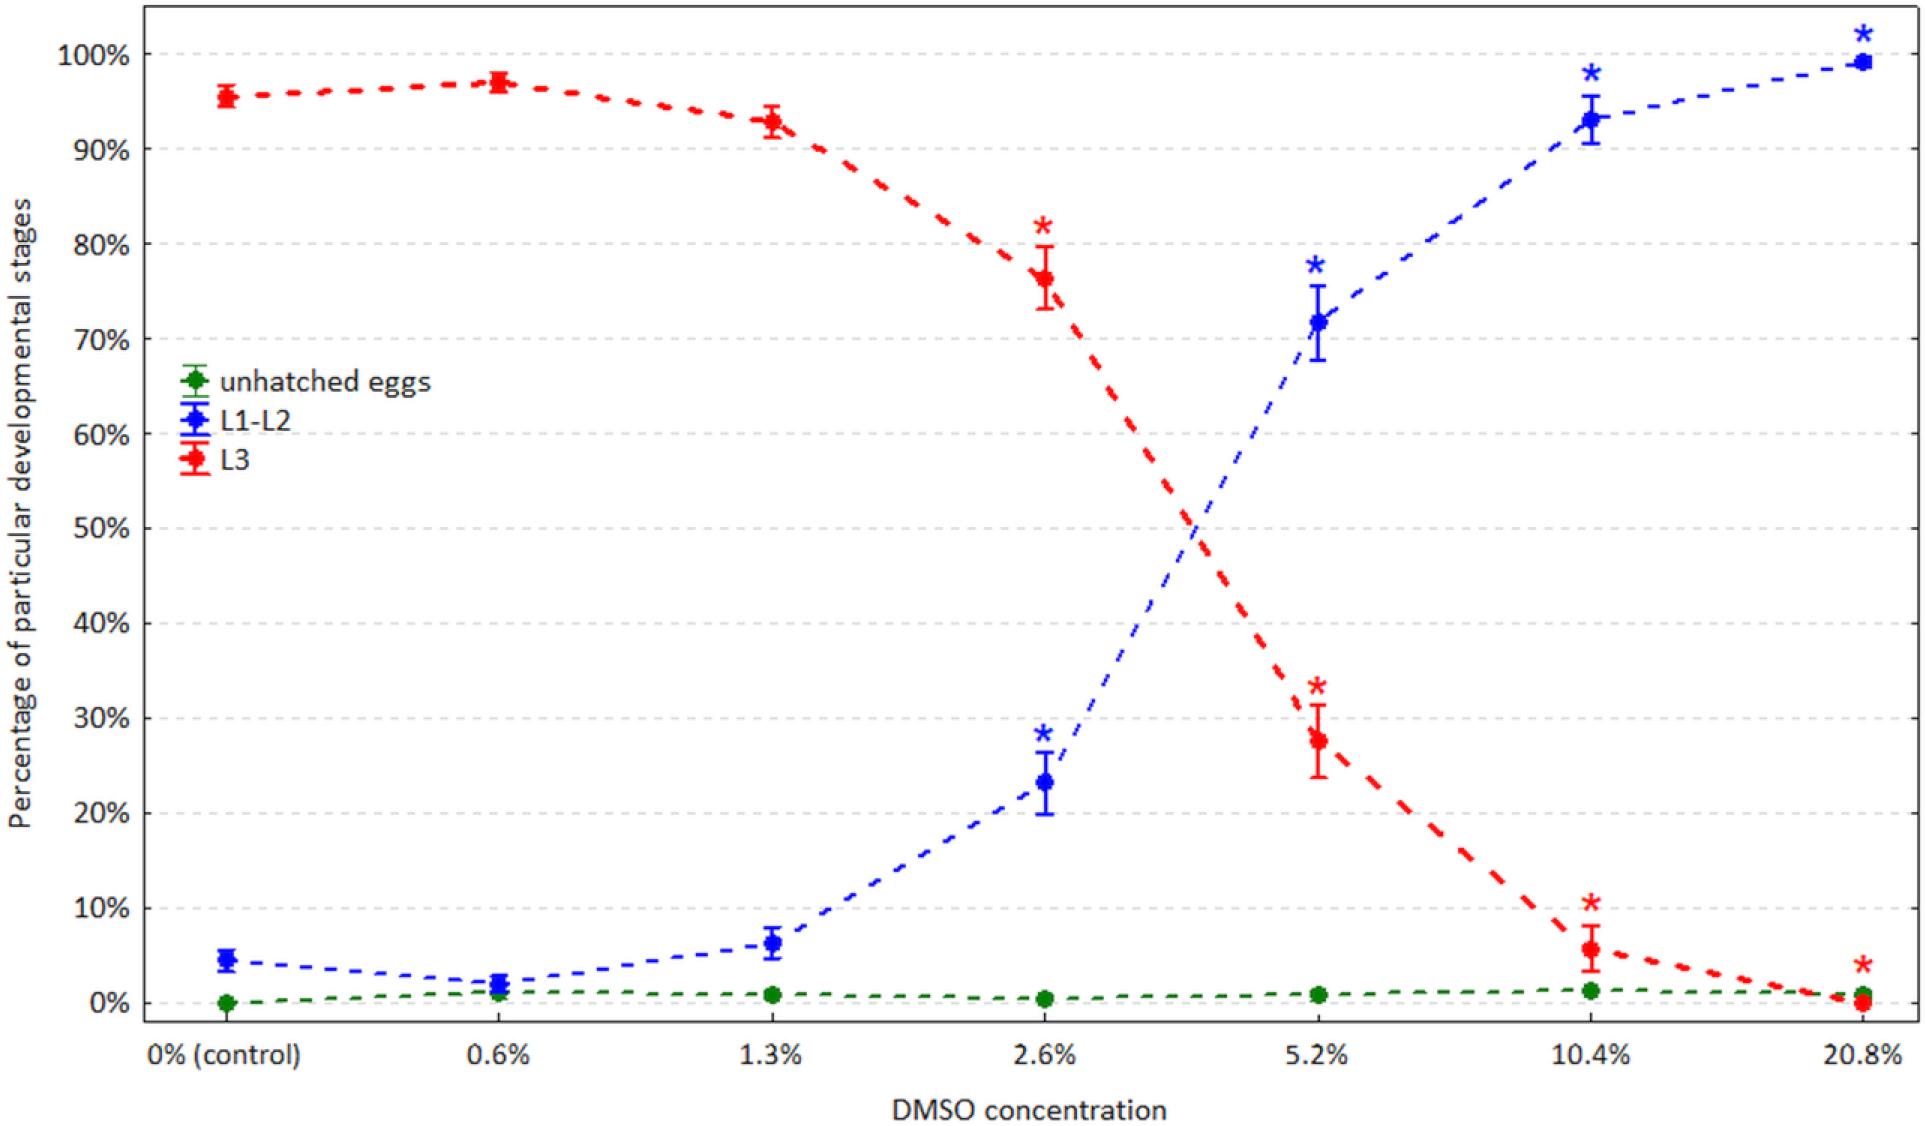
Fig. 2.
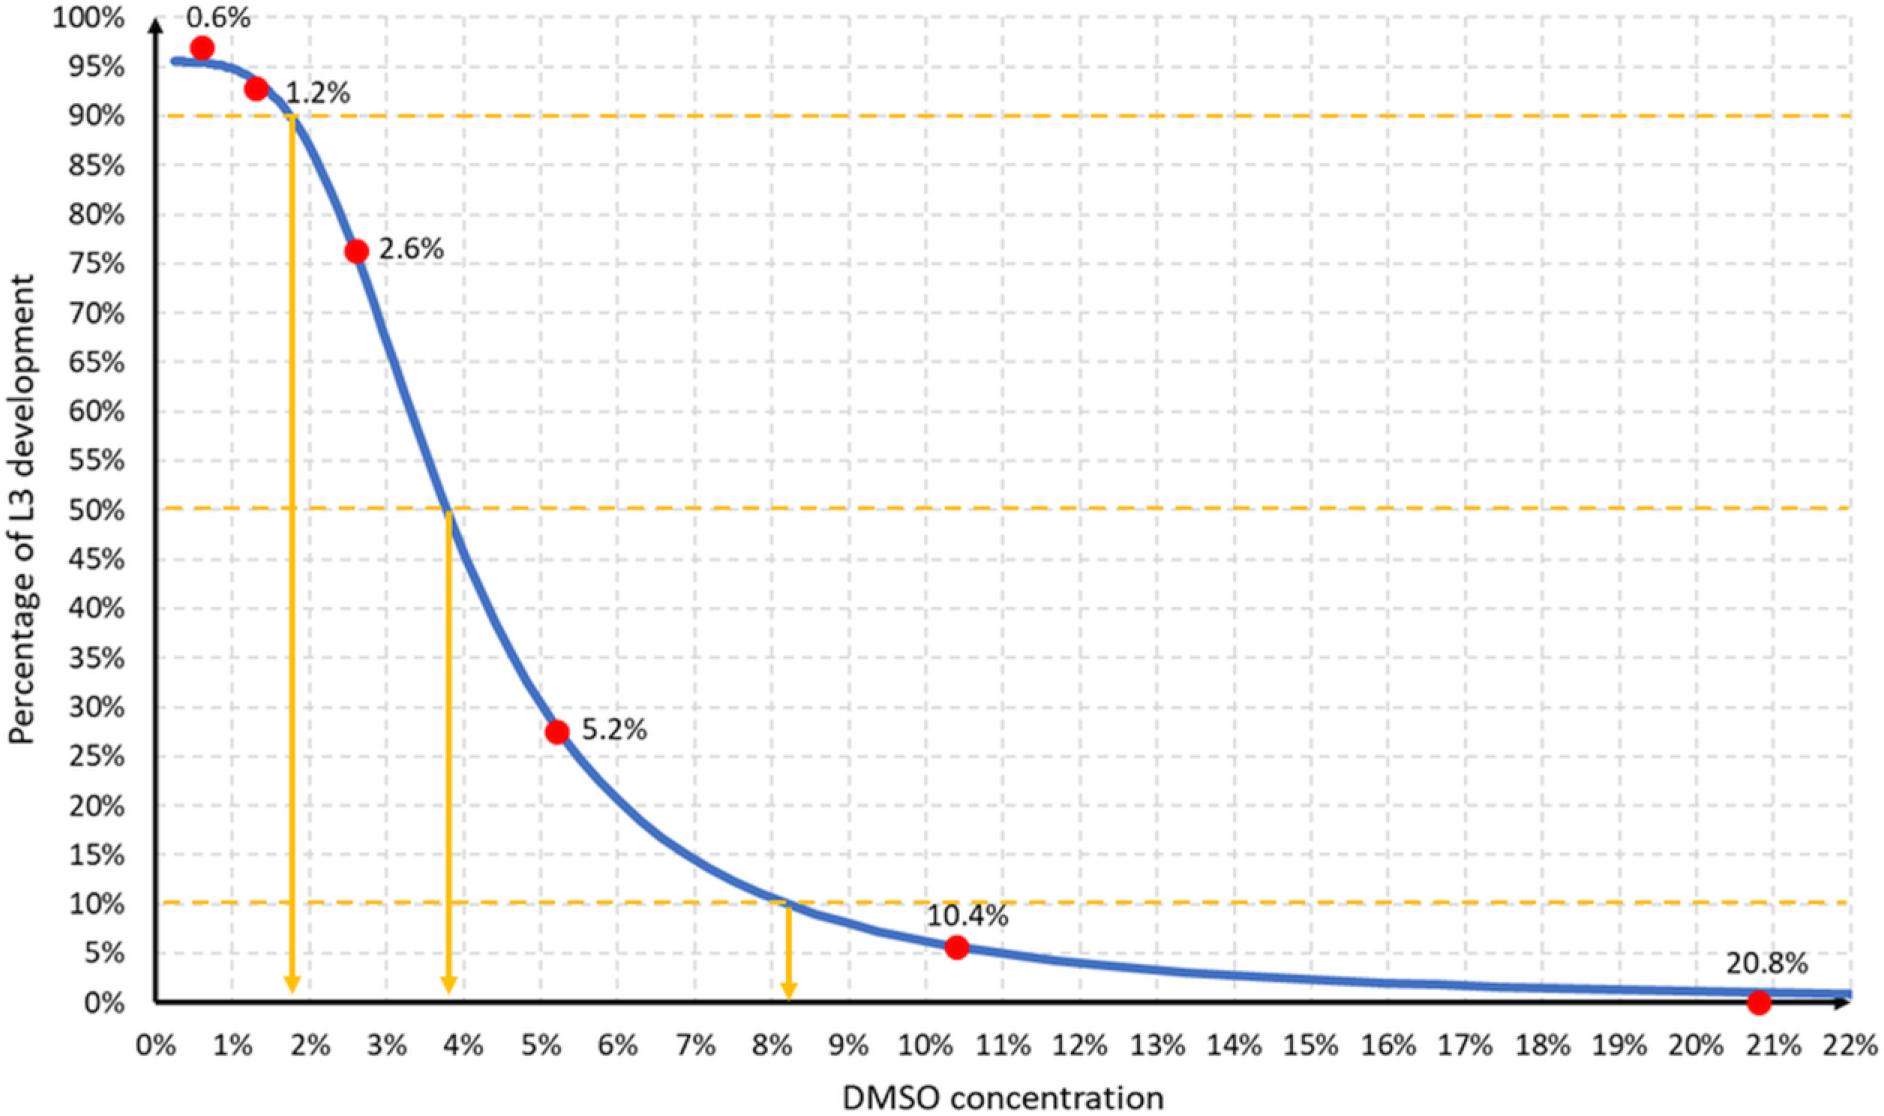
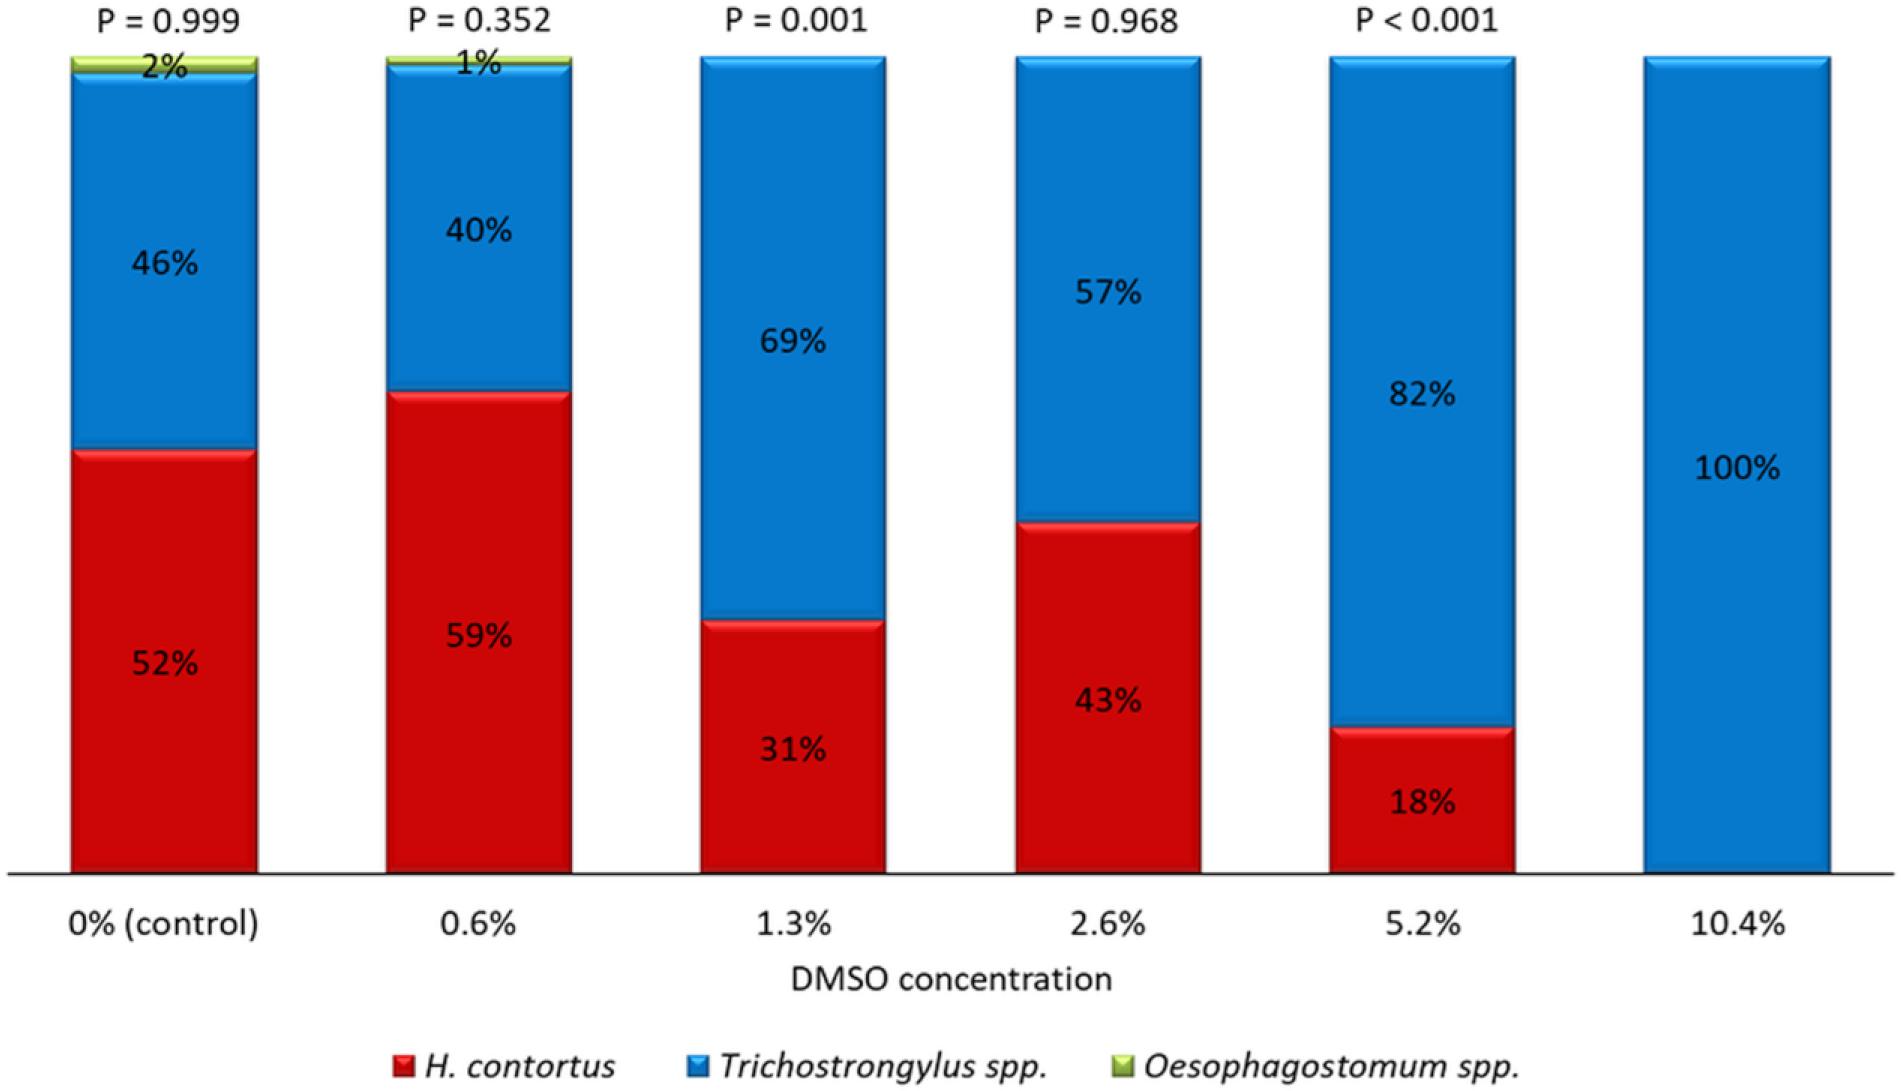
Fig. 3.
The observed percentage of eggs, larvae of the first and second stage (L1 and L2) and larvae of the third stage (L3; percentage development – PD) at increasing dimethyl sulfoxide (DMSO) concentrations
| DMSO concentration | Percentage of developmental stages observed after the 7-day incubation (%) a | ||||||
|---|---|---|---|---|---|---|---|
| n | L3 (PD) | Unhatched eggs | L1 and L2 | ||||
| P-value b | P-value b | P-value b | |||||
| 0.0% (control) | 30 | 95.5 ± 3.1 (87.5–100) | -c | 0.05 ± 0.28 (0–1.54) | -c | 4.43 ± 3.08 (0–12.5) | -c |
| 0.6% | 30 | 97.0 ± 2.6 (89.2–100) | 0.856 | 0.99 ± 1.60 (0–8.11) | 0.022* | 1.99 ± 2.26 (0–7.9) | 0.450 |
| 1.3% | 30 | 92.8 ± 4.4 (81.0–100) | 0.335 | 0.85 ± 1.27 (0–4.11) | 0.068 | 6.35 ± 4.40 (0–19.0) | 0.683 |
| 2.6% | 30 | 76.3 ± 8.8 (50.0–91.8) | <0.001* | 0.49 ± 0.90 (0–3.13) | 0.566 | 23.2 ± 8.8 (8.2–50.0) | <0.001* |
| 5.2% | 30 | 27.6 ± 10.4 (10.8–50.0) | <0.001* | 0.74 ± 1.43 (0–5.41) | 0.157 | 71.7 ± 10.5 (50.0–89.2) | <0.001* |
| 10.4% | 30 | 5.7 ± 6.6 (0–33.7) | <0.001* | 1.21 ± 1.53 (0–5.97) | 0.003* | 93.1 ± 6.6 (66.3–100) | <0.001* |
| 20.8% | 30 | 0.04 ± 0.22 (0–1.2) | <0.001* | 0.84 ± 1.27 (0–4.62) | 0.073 | 99.1 ± 1.3 (95.4–100) | <0.001* |