
Table 1.
Details of the bitches used in the study
| Group | A1 | A2 | B1 | B2 |
|---|---|---|---|---|
| Body condition score | 4–5/9 | 6–8/9 | 4–5/9 | 6–8/9 |
| Number of bitches | n = 16 | n = 14 | n = 16 | n = 14 |
| Age (years) | ||||
| Max. | 3 | 2.8 | 12.5 | 14.0 |
| Min. | 1.2 | 1.0 | 6.5 | 6.3 |
| Mean ± standard deviation | 2.06 ± 1.39 | 2.2 ± 0.92 | 8.3 ± 2.6 | 10.73 ± 2.34 |
| Body weight (kg) | ||||
| Max. | 23 | 35 | 25 | 43.5 |
| Min. | 2.5 | 6 | 4.3 | 4.2 |
| mean ± standard deviation | 8.07 ± 6.73 | 16.24 ± 7.07 | 10.5 ± 6.7 | 19.7 ± 13.71 |
| Breed | ||||
| mixed-breed | 5 | 4 | 4 | 4 |
| purebred | 11 | 10 | 12 | 10 |
| Progesterone (ng/mL) | ||||
| Max. | 25.93 | 36.65 | 39.03 | 49.98 |
| Min. | 1.277 | 1.439 | 1.856 | 1.495 |
| Mean ± standard deviation | 6.50 ± 4.30 | 9.795 ± 8.54 | 11.70 ± 9.68 | 12.44 ± 11.74 |
Table 2.
Primer sequences
| Gene name | Primer sequence | GenBank accession No. of source gene | Base pairs | Reference |
|---|---|---|---|---|
| Nucb2 | F: 5′-CAAGTGATTGATGTGCTGGAA-3′ R: 5′-GCCACTTGTTGTCTTTTCAGTTC-3′ | XM_534078 | 158 | (19) |
| Gapdh | F: 5′-GGGTCATCATCTCTGCTCCT-3′ R: 5′-AGTGGTCATGGATGACTTTGG-3′ | AF327898.1 | 150 | (26) |
| Actb | F: 5′-CTGGACTTCGAGCAGGAGAT-3′ R: 5′-GATACCGCATGATTCCATCC-3′ | AF021873.2 | 161 | (26) |
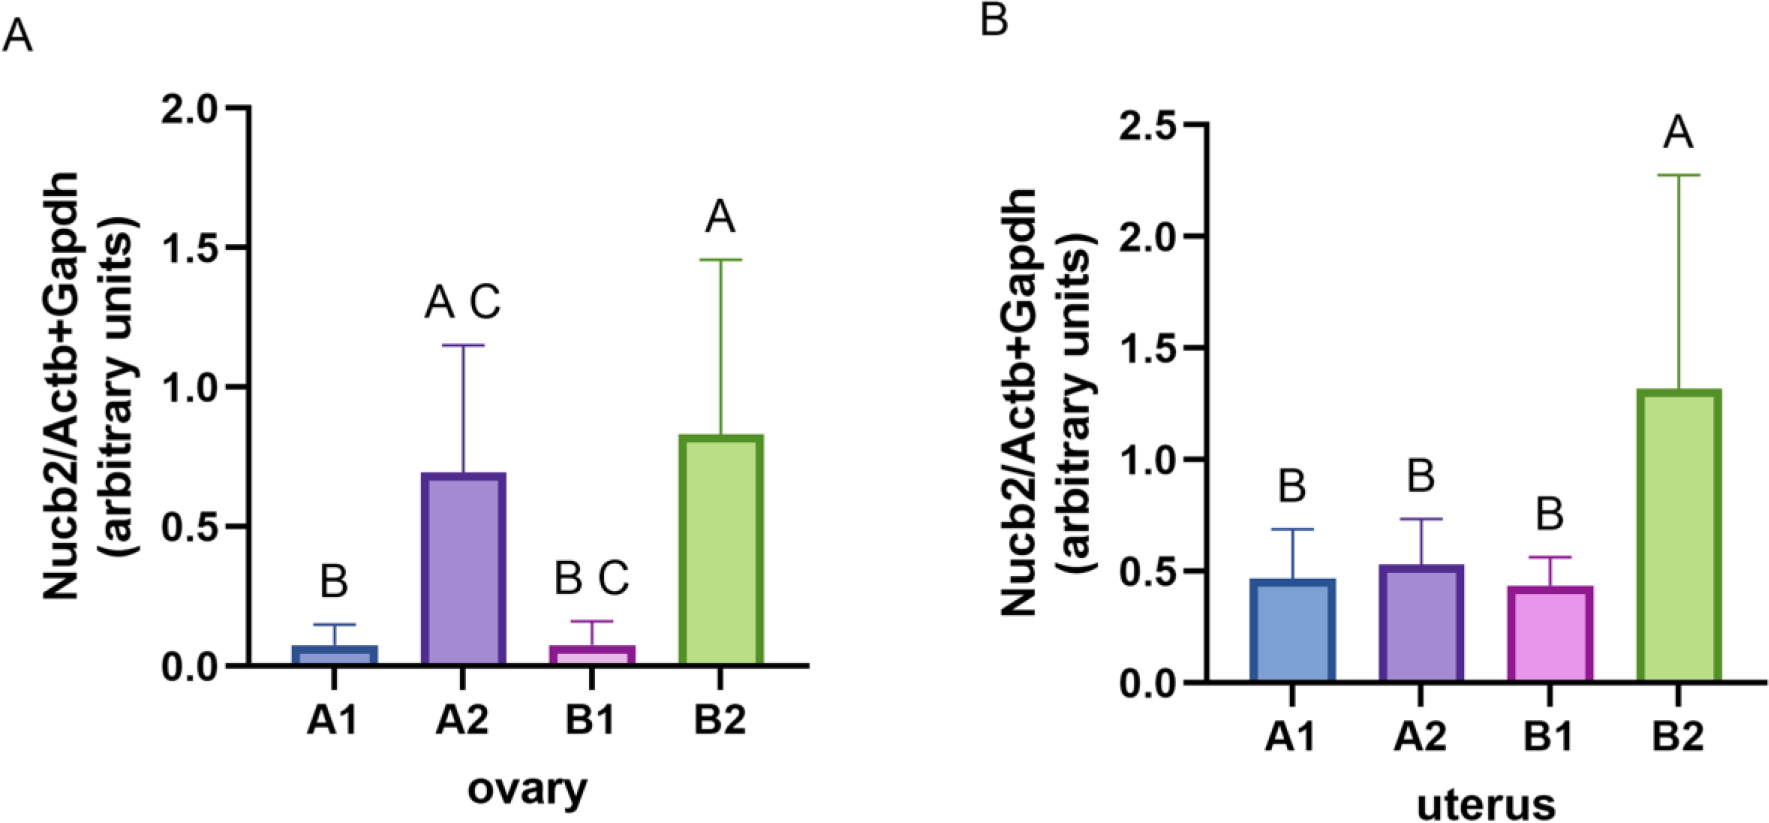
Fig. 1.
Relative expression of Nucb2 in A – the canine ovary (A) and B – the uterus normalised to the mean expression of the Actb and Gapdh housekeeping genes. Bars represent mean ± standard deviation. A, B and C – significant differences between groups (P-value < 0.05). A1 – younger bitches with optimal body weight (body condition score (BCS) = 4/9); A2 – younger confirmed overweight bitches (BCS > 5/9); B1 – elderly bitches with optimal body weight (BCS = 4/9); B2 – elderly confirmed overweight bitches (BCS > 5/9)
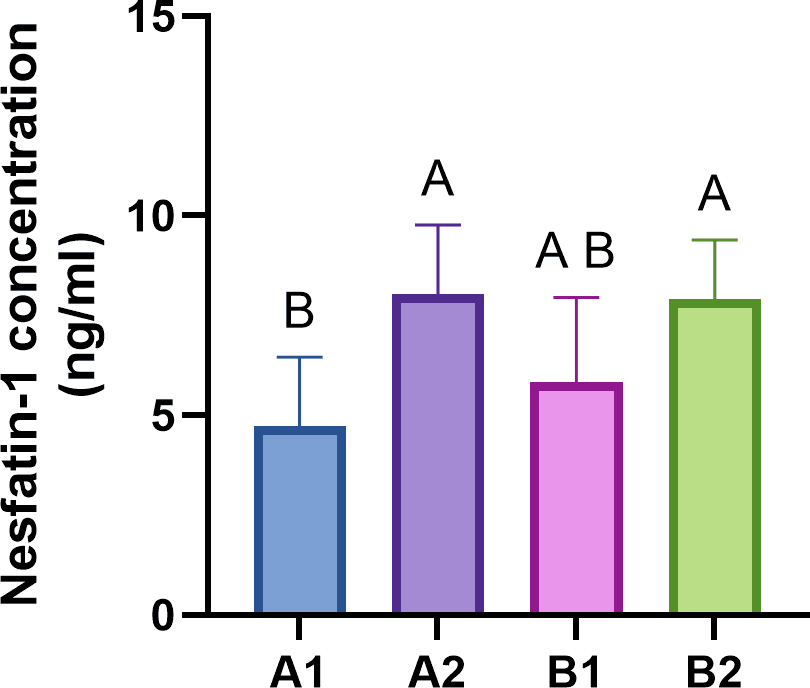
Fig. 2.
Concentrations of nesfatin-1 in peripheral blood from healthy bitches in optimal body condition (A1 and B1 groups) and overweight bitches (A2 and B2 groups). Bars represent the mean ± standard deviation. A and B – significant differences between groups (P-value < 0.05). A1 – younger bitches with optimal body weight (BCS = 4/9); A2 – younger confirmed overweight bitches (BCS > 5/9); B1 – elderly bitches with optimal body weight (BCS = 4/9); B2 – elderly confirmed overweight bitches (BCS > 5/9)
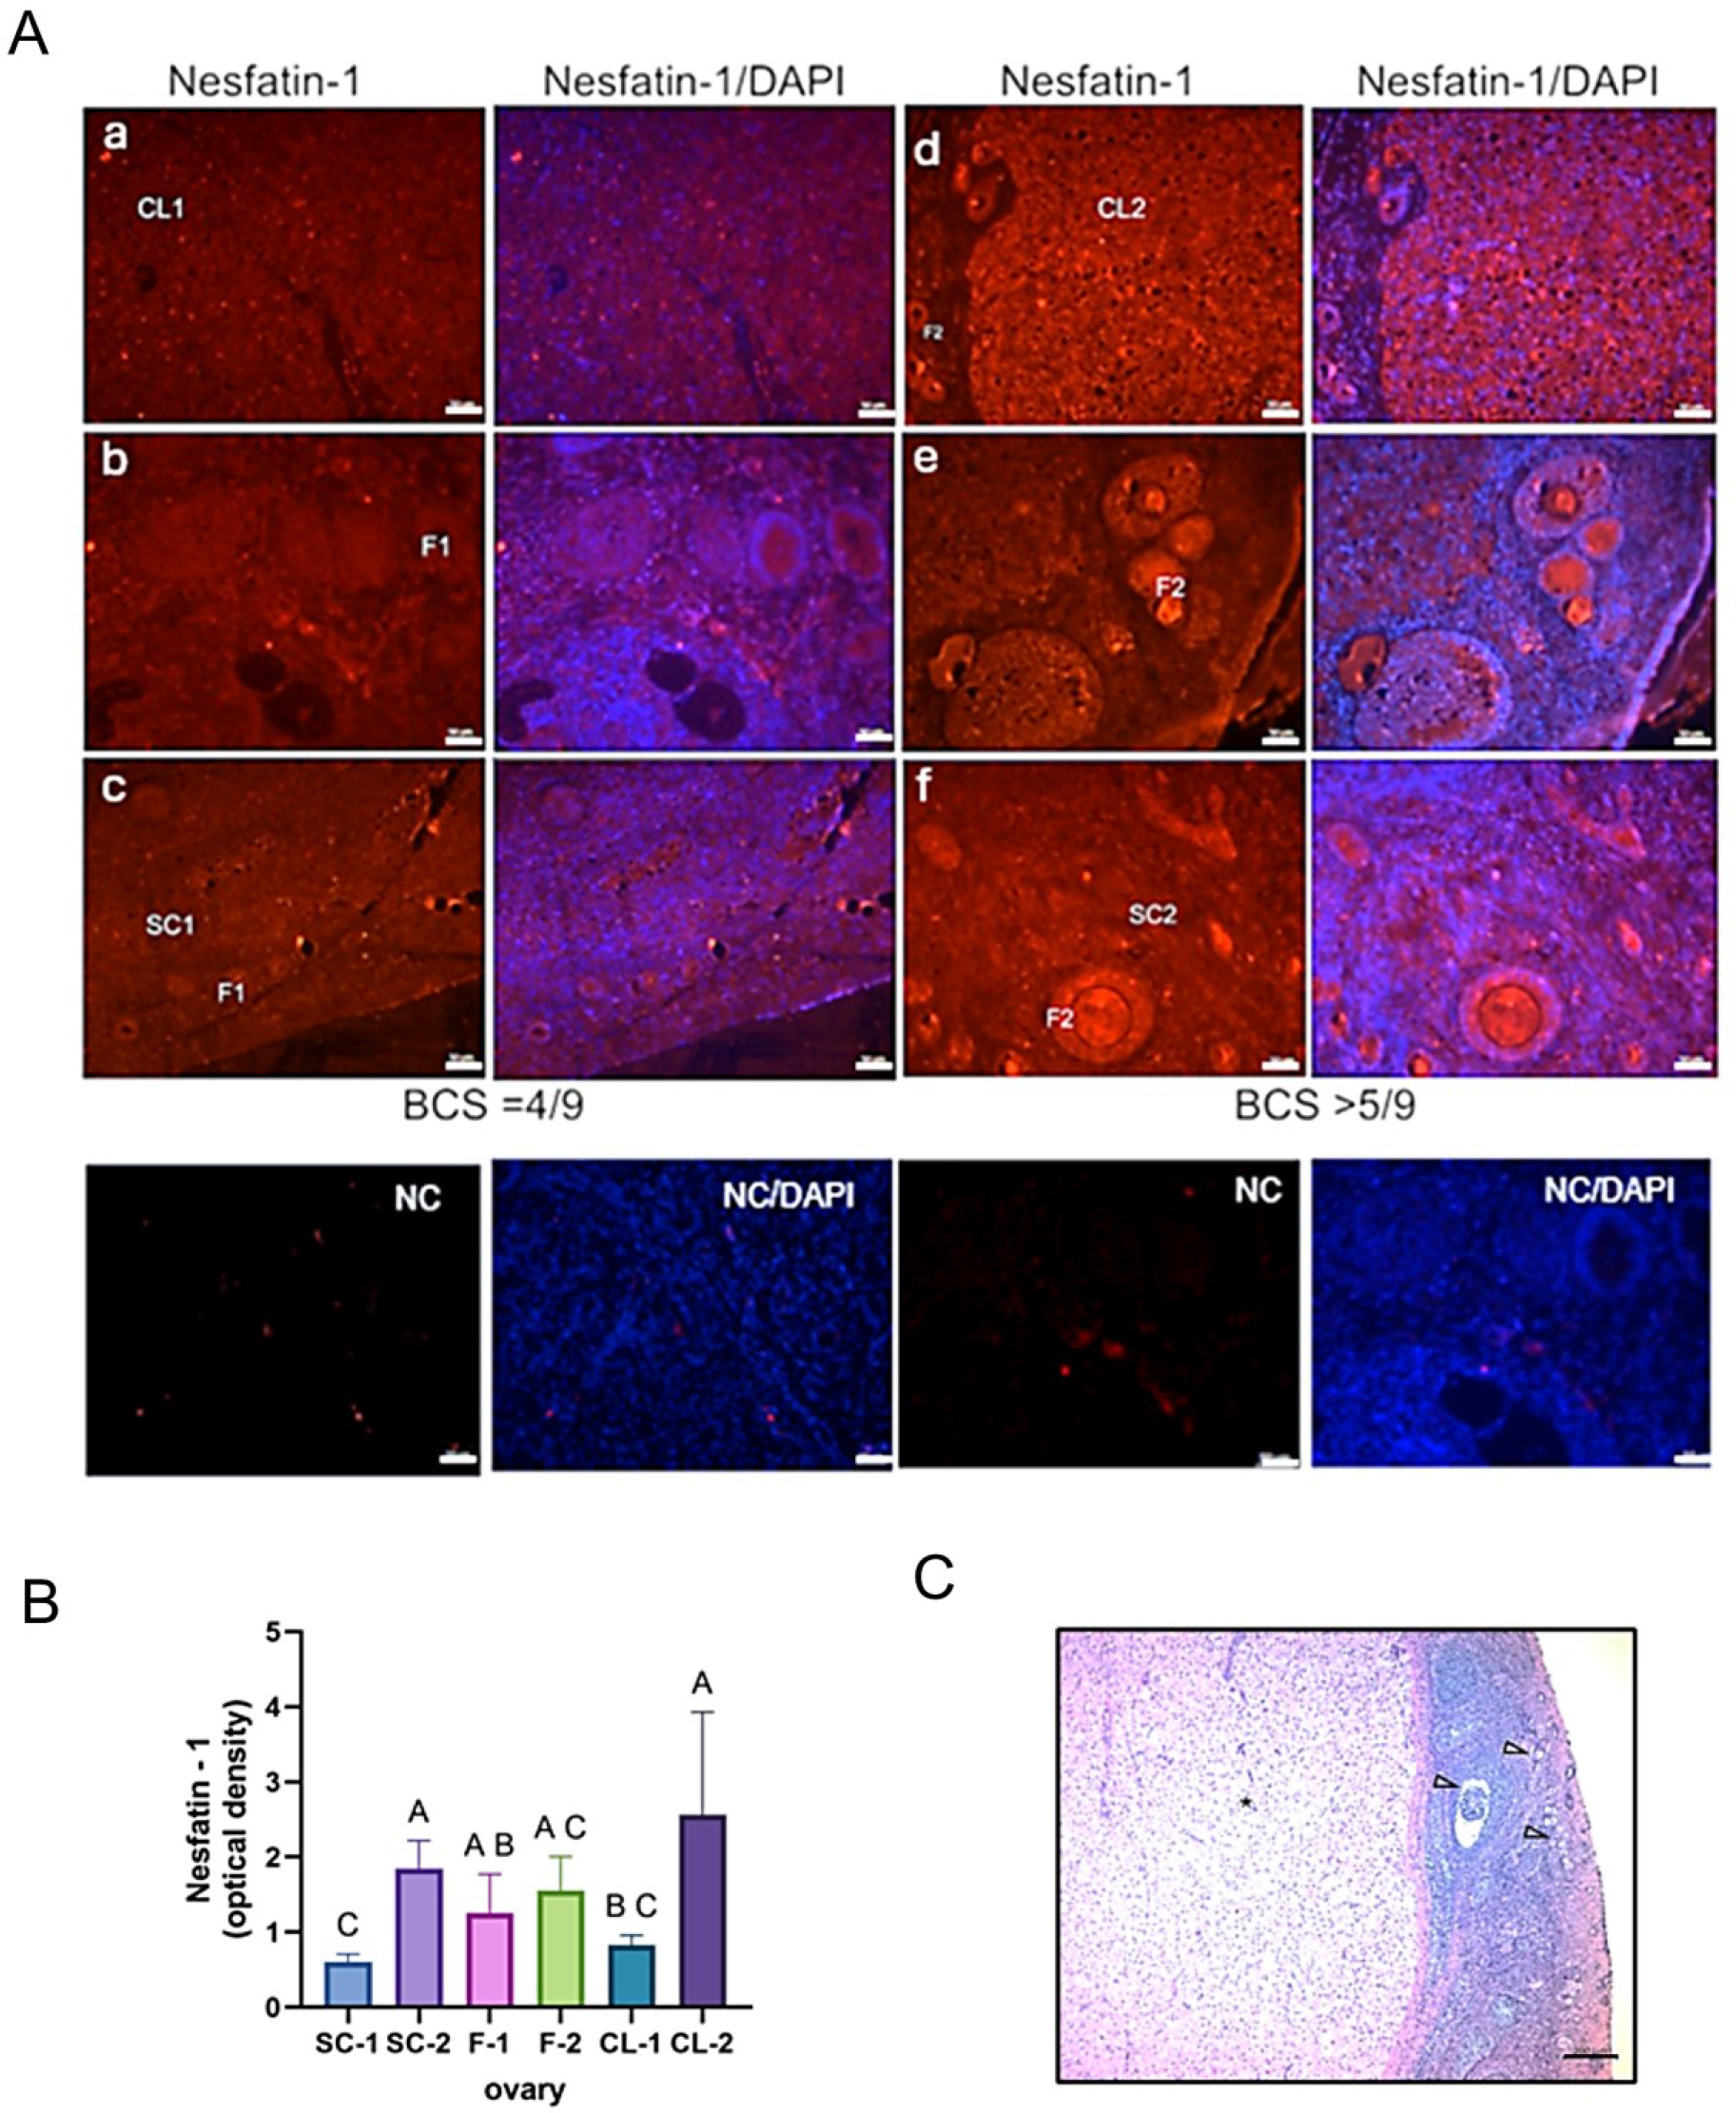
Fig. 3.
A – Representative canine ovary sections showing nesfatin-1 localisation (in red) and cell nuclei stained by 4′,6-diamidino-2-phenylindole (DAPI – in blue). Signal detection of nesfatin-1 in the ovaries of bitches with body condition score (BCS) = 4/9 (a, b and c) and overweight bitches with BCS > 5/9 (d, e and f). Scale bar – 50 μm. NC – negative control; B – Level of nesfatin-1 immunoreactivity analysed in a group of bitches with BCS = 4/9 and overweight bitches with BCS > 5/9. CL – corpus luteum; F – ovarian follicles; SC – ovarian cortical stromal cells. Bars represent the mean level of neuropeptide immunoreactivity ± standard deviation. A, B and C – statistically significant difference between groups at P-value < 0.05. SC-1, F-1 and CL-1 – dogs with BCS = 4/9; SC-2, F-2 and CL-2 – dogs with BCS > 5/9. C – haematoxylin-eosin staining in a representative photomicrograph of an ovarian section from healthy female dogs in the dioestrous phase; arrows – ovarian follicles; asterisk – corpus luteum. Scale bar – 200 μm
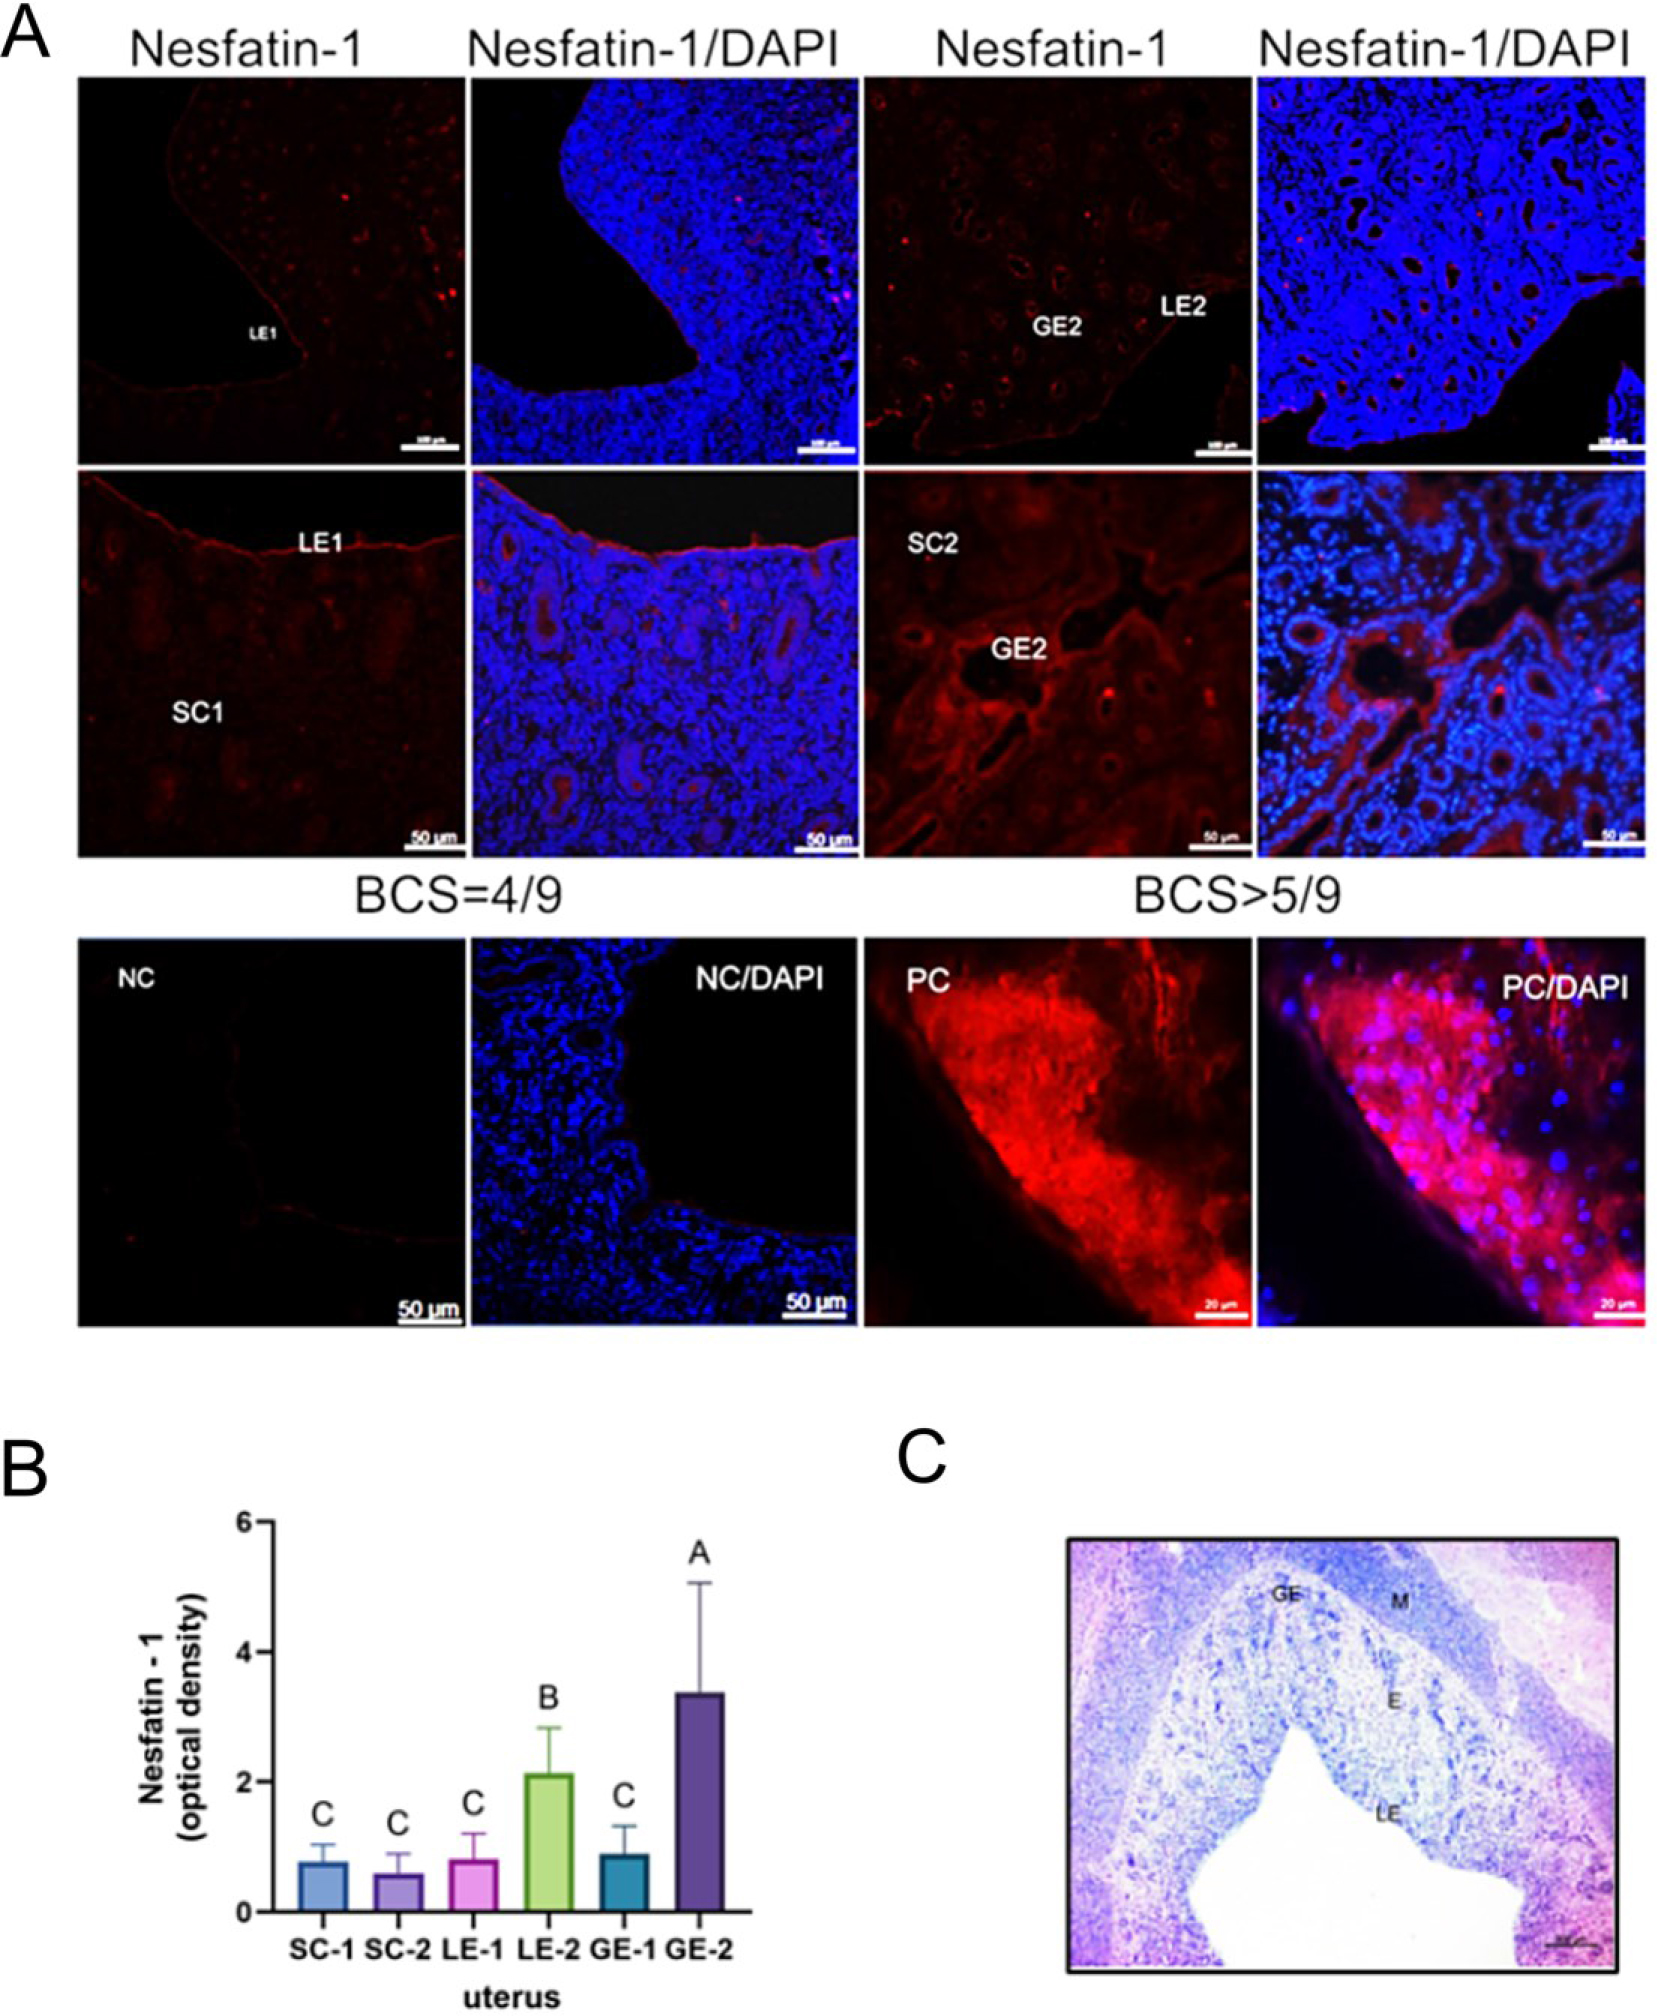
Fig. 4.
A – Representative canine uterus sections showing nesfatin-1 localisation (in red) and cell nuclei stained by 4′,6-diamidino-2-phenylindole (DAPI – in blue). Signal detection of nesfatin-1 in the uteri of bitches with body condition score (BCS) = 4/9 (a and b) and overweight individuals with BCS > 5/9 (c and d). Scale bar – 100 μm (a and c), 50 μm (b, d and negative control (NC)), 20 μm (positive control (PC)). B – Level of nesfatin-1 immunoreactivity in the endometrial epithelium (LE), the glandular epithelium (GE), and endometrial stromal cells (SC). Bars represent the mean level of neuropeptide immunoreactivity ± standard deviation. A, B and C – statistically significant difference between groups at P-value < 0.05. LE-1, GE-1 and SC-1 – dogs with BCS = 4/9; LE-2, GE-2 and SC-2 – dogs with BCS > 5/9. C – Representative photomicrograph of histological staining with haematoxylin and eosin of a uterine section from a healthy female dog in the dioestrous phase; M – myometrium; E – endometrium; Scale bar – 200 μm