
Fig. 1.
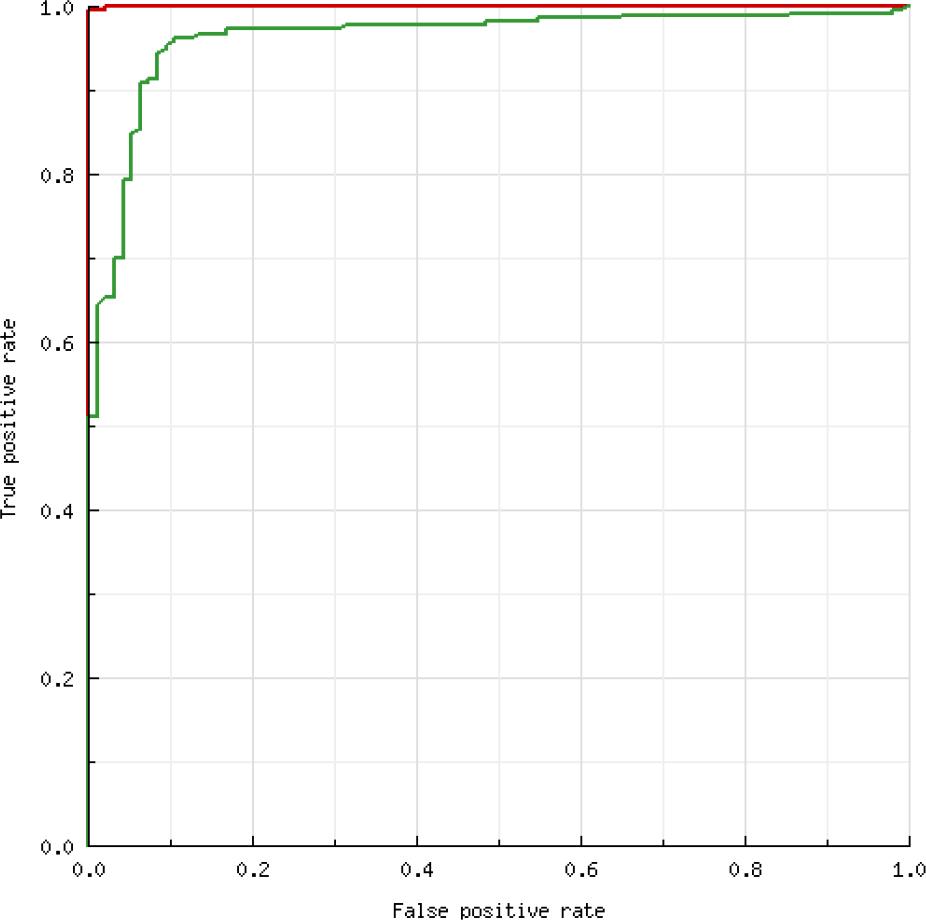
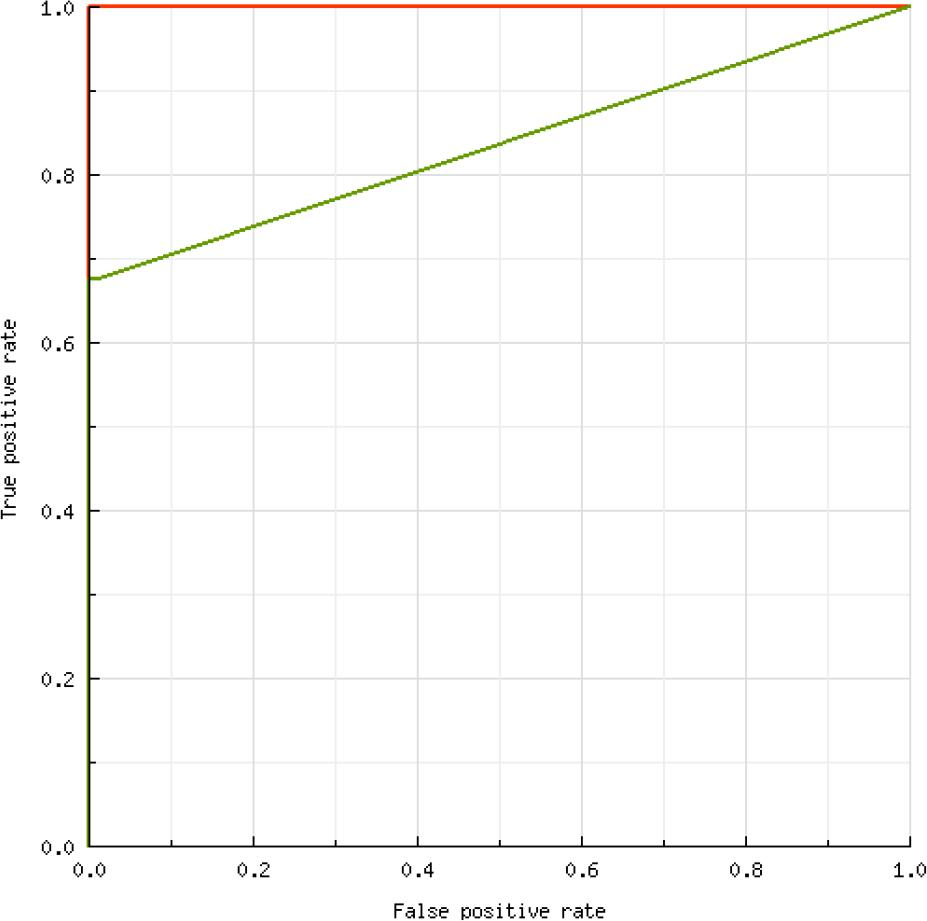
Fig. 2.
Sensitivity (SE), specificity (SP), negative and positive predictive values (NPV and PPV), and Cohen’s kappa coefficient (κ) obtained for testicular-only processing fluid using the ELISA manufacturer’s and receiver operating curve (ROC)-calculated cut-off values
| Parameter | ELISA cut-off | |
|---|---|---|
| Manufacturer’s (S/P ≥ 0.4) | ROC-calculated (S/P ≥ 0.1) | |
| SE (%) | 76.96 | 86.47 |
| SP (%) | 96.84 | 96.31 |
| NPV | 0.65 | 0.95 |
| PPV | 0.98 | 0.91 |
| κ | 0.65 | 0.86 |
Minimum, maximum and mean sample-to-positive ratio (S/P) values in the sera of female and male piglets and in testicular-only processing fluid (TOPF)
| Parameter | Females | Males | |
|---|---|---|---|
| Serum S/P | Serum S/P | TOPF S/P | |
| Min. | -0.018 | -0.032 | -0.030 |
| Mean | 1.412 | 1.279 | 0.694 |
| Max. | 3.500 | 3.220 | 2.610 |
The effect of pooling one low-, one moderately- and one highly-positive testicular-only processing fluid (TOPF) sample (classified by sample-to-positive-control ratio (S/P)) with 4, 9, 19, 39 and 79 negative TOPF samples
| Dilution | Low-positive samples | Moderately-positive samples | Highly-positive samples | ||||||
|---|---|---|---|---|---|---|---|---|---|
| S/Pa | Cut-off | S/P | Cut-off | S/P | Cut-off | ||||
| Manufacturer’s S/P ≥ 0.4 | Calculated S/P ≥ 0.1 | Manufacturer’s S/P ≥ 0.4 | Calculated S/P ≥ 0.1 | Manufacturer’s S/P ≥ 0.4 | Calculated S/P ≥ 0.1 | ||||
| Ndil | 0.95 | 1.87 | 2.18 | ||||||
| 1 : 5 | 0.35 | 0 | 1 | 0.99 | 1 | 1 | 1.32 | 1 | 1 |
| 1 : 10 | 0.08 | 0 | 0 | 0.51 | 1 | 1 | 0.99 | 1 | 1 |
| 1 : 20 | 0.05 | 0 | 0 | 0.22 | 0 | 1 | 0.54 | 1 | 1 |
| 1 : 40 | 0.04 | 0 | 0 | 0.17 | 0 | 1 | 0.24 | 0 | 1 |
| 1 : 80 | 0.02 | 0 | 0 | 0.12 | 0 | 1 | 0.13 | 0 | 1 |
| Ndil | 0.71 | 1.76 | 2.17 | ||||||
| 1 : 5 | 0.13 | 0 | 1 | 0.96 | 1 | 1 | 1.16 | 1 | 1 |
| 1 : 10 | 0.08 | 0 | 0 | 0.48 | 1 | 1 | 1.01 | 1 | 1 |
| 1 : 20 | 0.04 | 0 | 0 | 0.26 | 0 | 1 | 0.52 | 1 | 1 |
| 1 : 40 | 0.02 | 0 | 0 | 0.16 | 0 | 1 | 0.31 | 0 | 1 |
| 1 : 80 | 0.01 | 0 | 0 | 0.11 | 0 | 1 | 0.22 | 0 | 1 |
| Ndil | 0.60 | 1.69 | 2.16 | ||||||
| 1 : 5 | 0.11 | 0 | 1 | 0.81 | 1 | 1 | 1.11 | 1 | 1 |
| 1 : 10 | 0.07 | 0 | 0 | 0.41 | 1 | 1 | 0.62 | 1 | 1 |
| 1 : 20 | 0.03 | 0 | 0 | 0.21 | 0 | 1 | 0.38 | 0 | 1 |
| 1 : 40 | 0.01 | 0 | 0 | 0.1 | 0 | 1 | 0.25 | 0 | 1 |
| 1 : 80 | 0.00 | 0 | 0 | 0.08 | 0 | 0 | 0.16 | 0 | 1 |
| Ndil | 0.53 | 1.56 | 1.95 | ||||||
| 1 : 5 | 0.14 | 0 | 1 | 0.75 | 1 | 1 | 1.01 | 1 | 1 |
| 1 : 10 | 0.07 | 0 | 0 | 0.24 | 0 | 1 | 0.65 | 1 | 1 |
| 1 : 20 | 0.03 | 0 | 0 | 0.19 | 0 | 1 | 0.15 | 0 | 1 |
| 1 : 40 | 0.00 | 0 | 0 | 0.12 | 0 | 1 | 0.2 | 0 | 1 |
| 1 : 80 | 0.00 | 0 | 0 | 0.09 | 0 | 0 | 0.14 | 0 | 1 |
| Correctly classified | |||||||||
| 1 : 5 | 0/4 | 4/4 | 4/4 | 4/4 | 4/4 | 4/4 | |||
| 1 : 10 | 0/4 | 0/4 | 3/4 | 4/4 | 4/4 | 4/4 | |||
| 1 : 20 | 0/4 | 0/4 | 0/4 | 4/4 | 2/4 | 4/4 | |||
| 1 : 40 | 0/4 | 0/4 | 0/4 | 4/4 | 0/4 | 4/4 | |||
| 1 : 80 | 0/4 | 0/4 | 0/4 | 2/4 | 0/4 | 4/4 | |||
| Total | 0/20 | 4/20 | 7/20 | 18/20 | 10/20 | 20/20 | |||
Minimum, maximum and mean threshold cycle (Ct) values in the serum of female and male piglets and in testicular-only processing fluid (TOPF)
| Parameter | Females | Males | |
|---|---|---|---|
| Serum Ct | Serum Ct | TOPF Ct | |
| Min. | 19.74 | 19.36 | 21.27 |
| Mean | 34.39 | 34.16 | 31.78 |
| Max. | 44.52 | 44.93 | 44.93 |
Sensitivity (SE), specificity (SP), negative and positive predictive values (NPV and PPV), and Cohen’s kappa coefficient (κ) obtained in real-time reverse-transcription (RT)-PCR for testicular-only processing fluid using the manufacturer’s and the receiver operating curve (ROC)-calculated cut-off values
| Real-time RT-PCR cut-off | ||
|---|---|---|
| Parameter | Manufacturer’s (Ct < 45) | ROC-calculated (Ct < 43.96) |
| SE (%) | 67.57 | 67.57 |
| SP (%) | 98.91 | 100.00 |
| NPV | 0.94 | 0.92 |
| PPV | 0.92 | 1.00 |
| κ | 0.74 | 0.77 |
The effect of pooling one low-, one moderately- and one highly-positive testicular-only processing fluid (TOPF) sample with 9, 19, 39, 79, 159 and 319 negative TOPF samples
| Dilution | Low-positive samples | Moderately-positive samples | Highly-positive samples | ||||||
|---|---|---|---|---|---|---|---|---|---|
| Cta | Cut-off | Ct | Cut-off | Ct | Cut-off | ||||
| Manufacturer’s Ct < 45 | Calculated Ct < 43.96 | Manufacturer’s Ct < 45 | Calculated Ct < 43.96 | Manufacturer’s Ct < 45 | Calculated Ct < 43.96 | ||||
| Ndil | 38.34 | - | - | 34.09 | - | - | 21.9 | - | - |
| 1 : 10 | 39.16 | 1 | 1 | 35.32 | 1 | 1 | 26.81 | 1 | 1 |
| 1 : 20 | 40.88 | 1 | 1 | 39.05 | 1 | 1 | 27.75 | 1 | 1 |
| 1 : 40 | 0 | 0 | 0 | 39.16 | 1 | 1 | 29.02 | 1 | 1 |
| 1 : 80 | 0 | 0 | 0 | 0 | 0 | 0 | 29.92 | 1 | |
| 1 : 160 | 0 | 0 | 0 | 0 | 0 | 0 | 30.32 | 1 | 1 |
| 1 : 320 | 0 | 0 | 0 | 0 | 0 | 0 | 32.18 | 1 | 1 |
| Ndil | 43.7 | - | - | 34.16 | - | - | 22.62 | - | - |
| 1 : 10 | 0 | 0 | 0 | 35.24 | 1 | 1 | 25.08 | 1 | 1 |
| 1 : 20 | 0 | 0 | 0 | 43.00 | 1 | 1 | 25.45 | 1 | 1 |
| 1 : 40 | 0 | 0 | 0 | 43.66 | 1 | 1 | 27.08 | 1 | 1 |
| 1 : 80 | 0 | 0 | 0 | 44.71 | 1 | 0 | 27.85 | 1 | 1 |
| 1 : 160 | 0 | 0 | 0 | 0 | 0 | 0 | 28.04 | 1 | 1 |
| 1 : 320 | 0 | 0 | 0 | 0 | 0 | 0 | 29.43 | 1 | 1 |
| Ndil | 43.96 | - | - | 27.7 | - | - | 25.00 | - | - |
| 1 : 10 | 0 | 0 | 0 | 29.48 | 1 | 1 | 26.59 | 1 | 1 |
| 1 : 20 | 0 | 0 | 0 | 30.95 | 1 | 1 | 28.38 | 1 | 1 |
| 1 : 40 | 0 | 0 | 0 | 33.36 | 1 | 1 | 29.94 | 1 | 1 |
| 1 : 80 | 0 | 0 | 0 | 33.66 | 1 | 1 | 30.63 | 1 | 1 |
| 1 : 160 | 0 | 0 | 0 | 43.47 | 1 | 1 | 31.28 | 1 | 1 |
| 1 : 320 | 0 | 0 | 0 | 43.78 | 1 | 1 | 33.05 | 1 | 1 |
| Correctly classified | |||||||||
| 1 : 10 | 1/3 | 1/3 | 3/3 | 3/3 | 3/3 | 3/3 | |||
| 1 : 20 | 1/3 | 1/3 | 3/3 | 3/3 | 3/3 | 3/3 | |||
| 1 : 40 | 0/3 | 0/3 | 3/3 | 3/3 | 3/3 | 3/3 | |||
| 1 : 80 | 0/3 | 0/3 | 2/3 | 1/3 | 3/3 | 3/3 | |||
| 1 : 160 | 0/3 | 0/3 | 1/3 | 1/3 | 3/3 | 3/3 | |||
| 1 : 320 | 0/3 | 0/3 | 1/3 | 1/3 | 3/3 | 3/3 | |||
| Total | 2/18 | 2/18 | 13/18 | 12/18 | 18/18 | 18/18 | |||