
Fig. 1.
The results of pigeon circovirus quantification by droplet digital PCR in blood throughout the experimental period
| Day of sampling | |||||||
|---|---|---|---|---|---|---|---|
| 0 | 7 | 14 | 21 | 28 | 35 | 42 | |
| Mean PiCV viral load | 342.60 | 1,334.8 | 6,054.07 | 5,526.86 | 4,665.00 | 1,261.54 | 202.69 |
| SD of PiCV viral load | 859.24 | 3,964.54 | 14,556.08 | 11,115.70 | 10,974.15 | 4,181.36 | 679.48 |
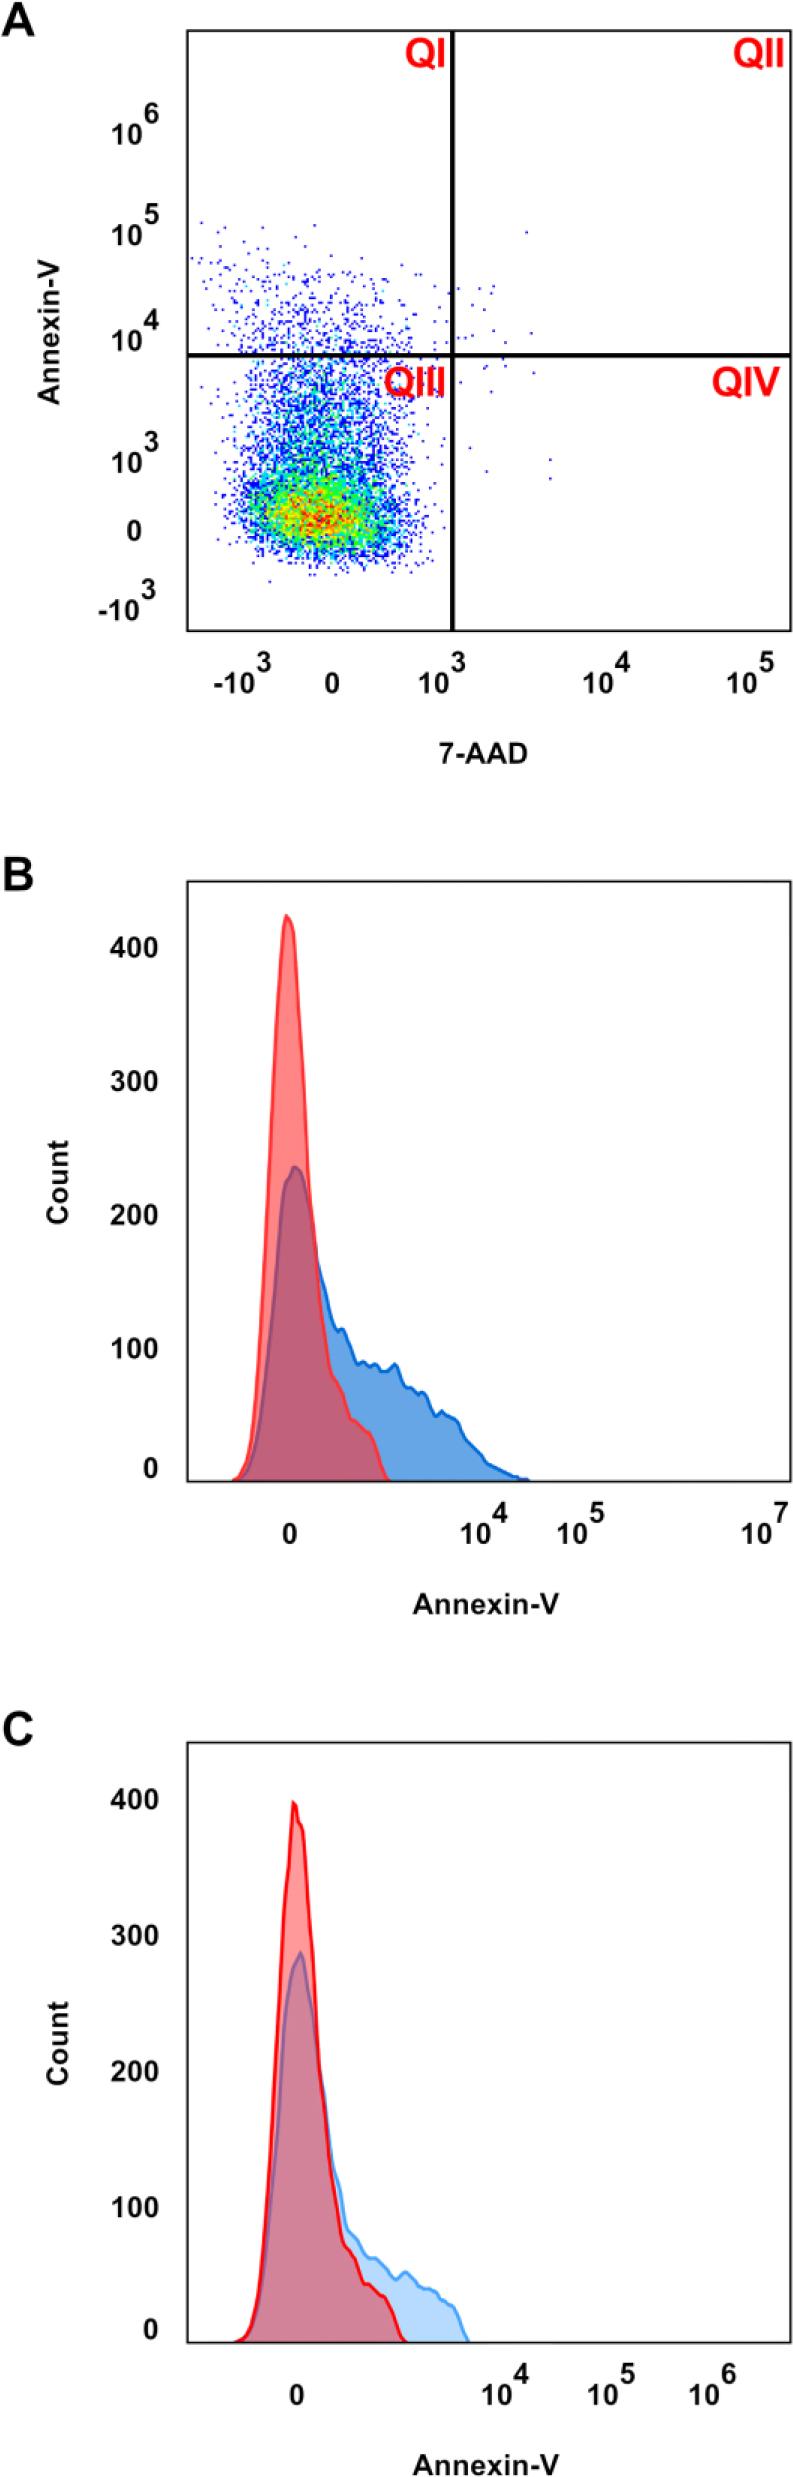
The percentage of B IgM+ lymphocytes, including the apoptotic (APO) and necrotic (NECRO) cells, in the population of blood mononuclear cells of the experimental and control pigeons throughout the experiment
| Day of sampling | Group | |||||||||||
|---|---|---|---|---|---|---|---|---|---|---|---|---|
| Experimental | Control | |||||||||||
| B IgM+ (%) | B IgM APO (%) | B IgM NECRO (%) | B IgM+ (%) | B IgM APO (%) | B IgM NECRO (%) | |||||||
| Mn | SD | Mn | SD | Mn | SD | Mn | SD | Mn | SD | Mn | SD | |
| 0 | 7.73 | 0.9 | 1.99a | 0.64 | 0.45 | 0.78 | 7.17 | 0.83 | 3.32b | 2.1 | 0.16 | 0.15 |
| 7 | 7.60 | 1.28 | 2.46 | 1.35 | 0.22 | 0.33 | 7.17 | 0.83 | 3.32 | 2.1 | 0.16 | 0.15 |
| 14 | 7.14 | 0.98 | 3.50 | 1.49 | 0.28a | 0.22 | 6.95 | 1.26 | 3.69 | 0.78 | 0.67b | 0.48 |
| 21 | 7.39 | 0.67 | 1.68 | 0.44 | 0.12 | 0.08 | 7.04 | 0.37 | 1.56 | 0.58 | 0.14 | 0.08 |
| 28 | 7.63 | 0.82 | 1.07 | 0.32 | 0.08 | 0.07 | 6.92 | 0.70 | 1.18 | 0.02 | 0.02 | 0.03 |
| 35 | 6.93 | 0.67 | 2.10 | 0.56 | 0.16 | 0.17 | 6.36 | 0.34 | 1.67 | 0.39 | 0.31 | 0.16 |
| 42 | 7.70 | 0.74 | 2.01 | 0.63 | 0.04a | 0.05 | 7.27 | 0.55 | 3.10 | 2.70 | 0.17b | 0.17 |
The percentage of B IgM+ lymphocytes, including the apoptotic (APO) and necrotic (NECRO) cells, in the population of spleen mononuclear cells of the experimental and control pigeons on the last day of the experiment
| Parameter | Group | |||
|---|---|---|---|---|
| Experimental | Control | |||
| Mn | SD | Mn | SD | |
| B IgM+ (%) | 11.29 | 0.60 | 11.23 | 1.02 |
| B IgM APO (%) | 5.14 | 2.77 | 3.62 | 1.31 |
| B IgM NECRO (%) | 0.12 | 0.09 | 0.11 | 0.05 |