Fig. 1.
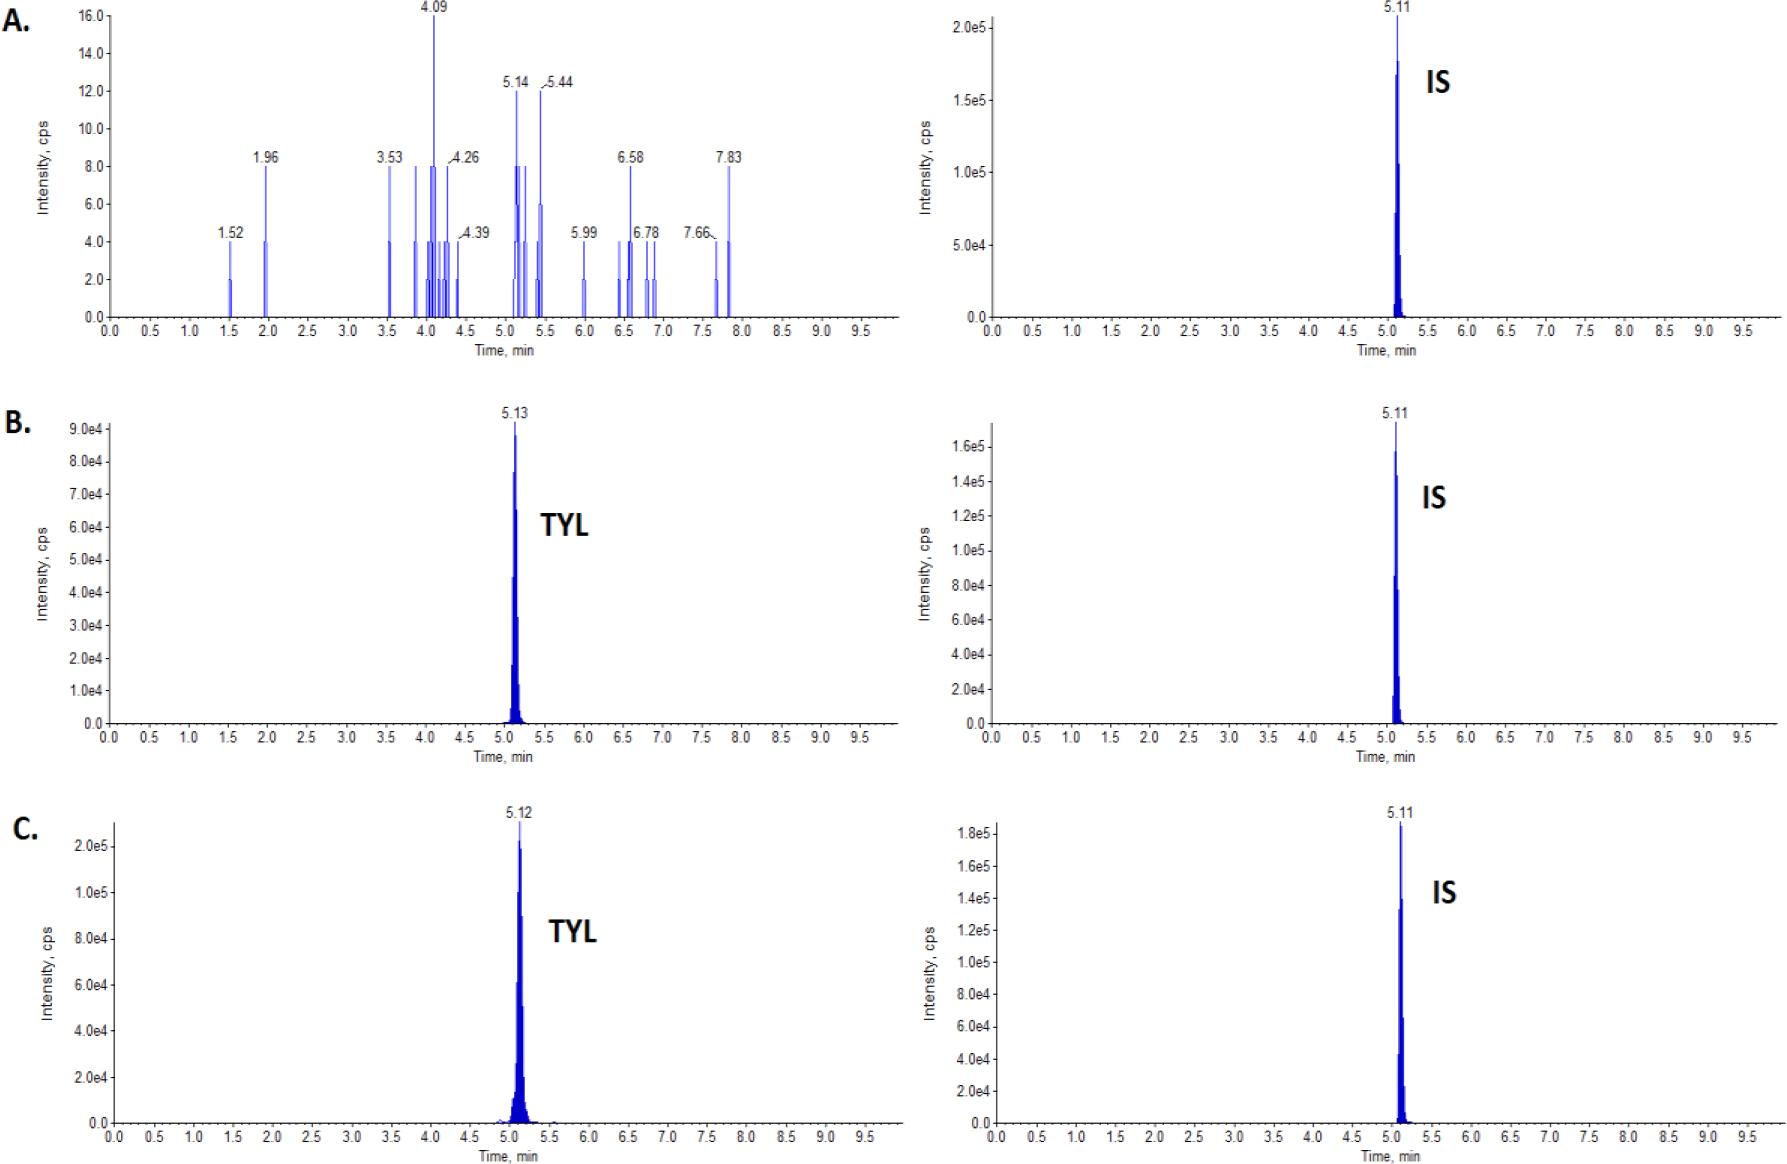
Fig. 2.
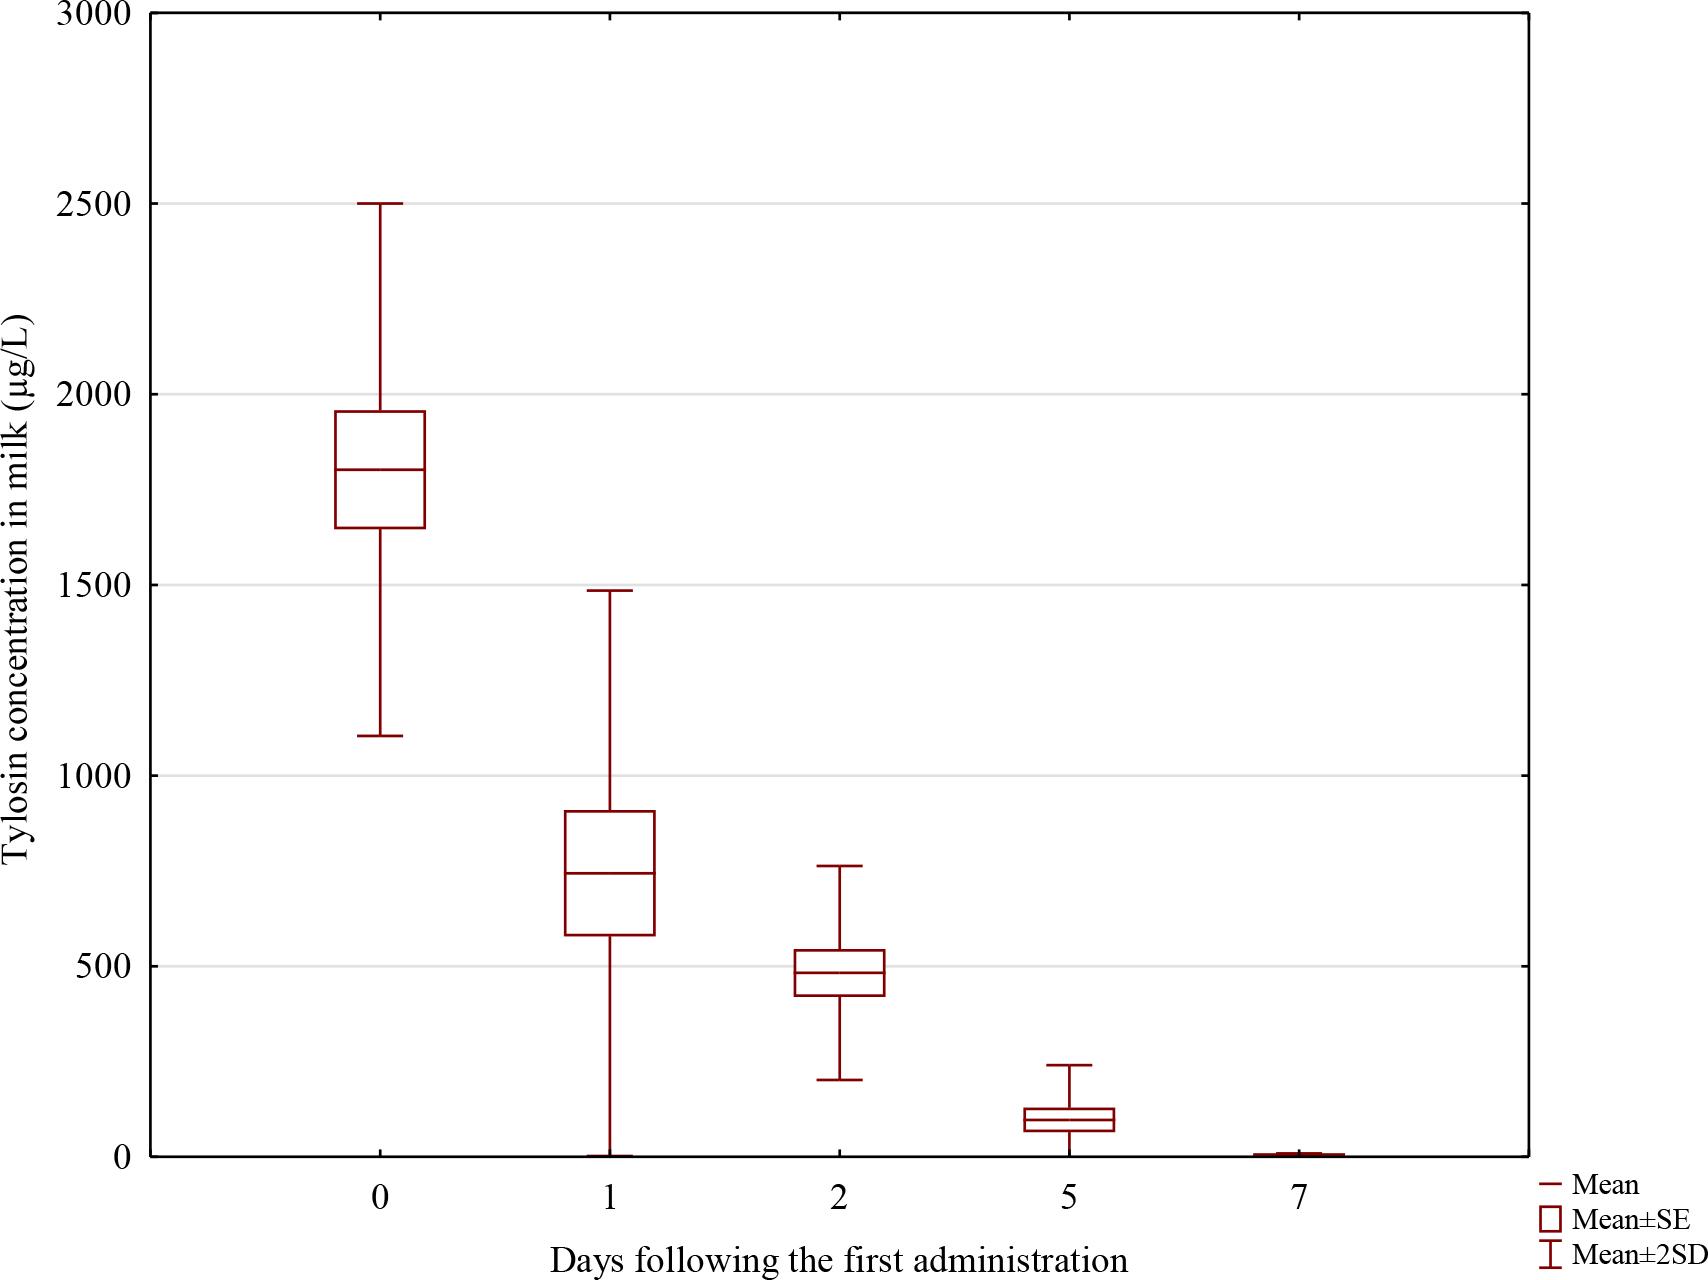
Tylosin residues in milk samples (μg/L) after the intramuscular administration of the antibiotic
| Sampling time (h) | Goats (n = 5) (1) | Goats (n = 24) (32) | Ewes (n = 7) (26) | Sows (n = 5) (this study) |
|---|---|---|---|---|
| 0 | -* | -* | 0* | 0* |
| 2 | 2,940 | - | - | |
| 3 | - | - | - | 1,802 |
| 4 | 1,730 | - | - | - |
| 6 | 700 | - | - | - |
| 8 | 390 | - | - | - |
| 10 | 160 | - | - | - |
| 12 | 0 | - | 632 | - |
| 24 | - | -* | 128* | 371* |
| 36 | - | - | 1,822 | - |
| 48 | - | -* | 471* | 482* |
| 60 | - | - | 1647 | - |
| 72 | - | 198 | 263* | - |
| 84 | - | - | 1,046 | - |
| 96 | - | NS | 161* | - |
| 108 | - | - | 900 | - |
| 120 | - | NS | 142 | 97 |
| 132 | - | - | 31 | - |
| 144 | - | NS | 0 | - |
| 156 | - | - | - | - |
| 168 | - | 0 | - | 6 |
Validation parameters of the method for the analysis of tylosin in sow’s milk
| Analyte | Fortification level (μg/L) | Repeatability (%) | Reproducibility (%) | Recovery (%) |
|---|---|---|---|---|
| Tylosin | 5.0 | 9.2 | 13.8 | 98.2 |
| 50.0 | 7.0 | 6.7 | 105.8 | |
| 100.0 | 4.7 | 4.1 | 100.6 |