
Fig. 1.
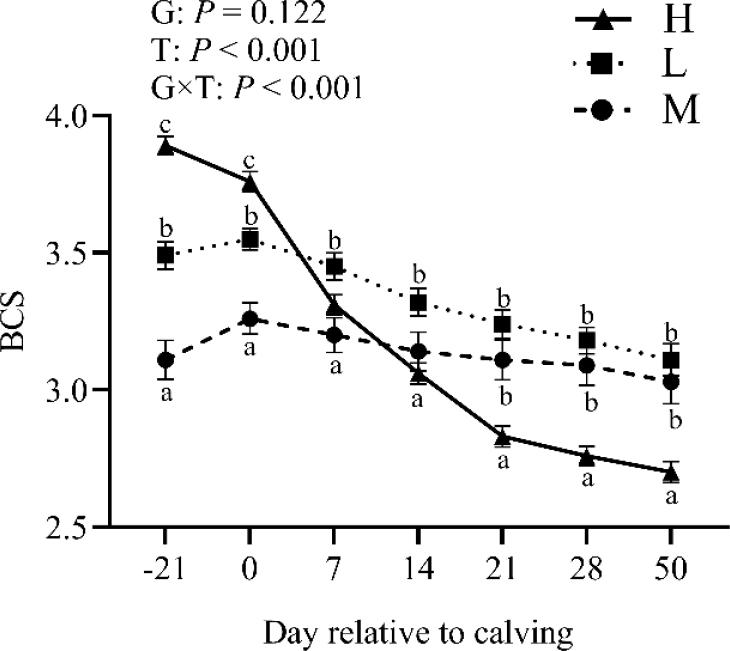
Fig. 2.
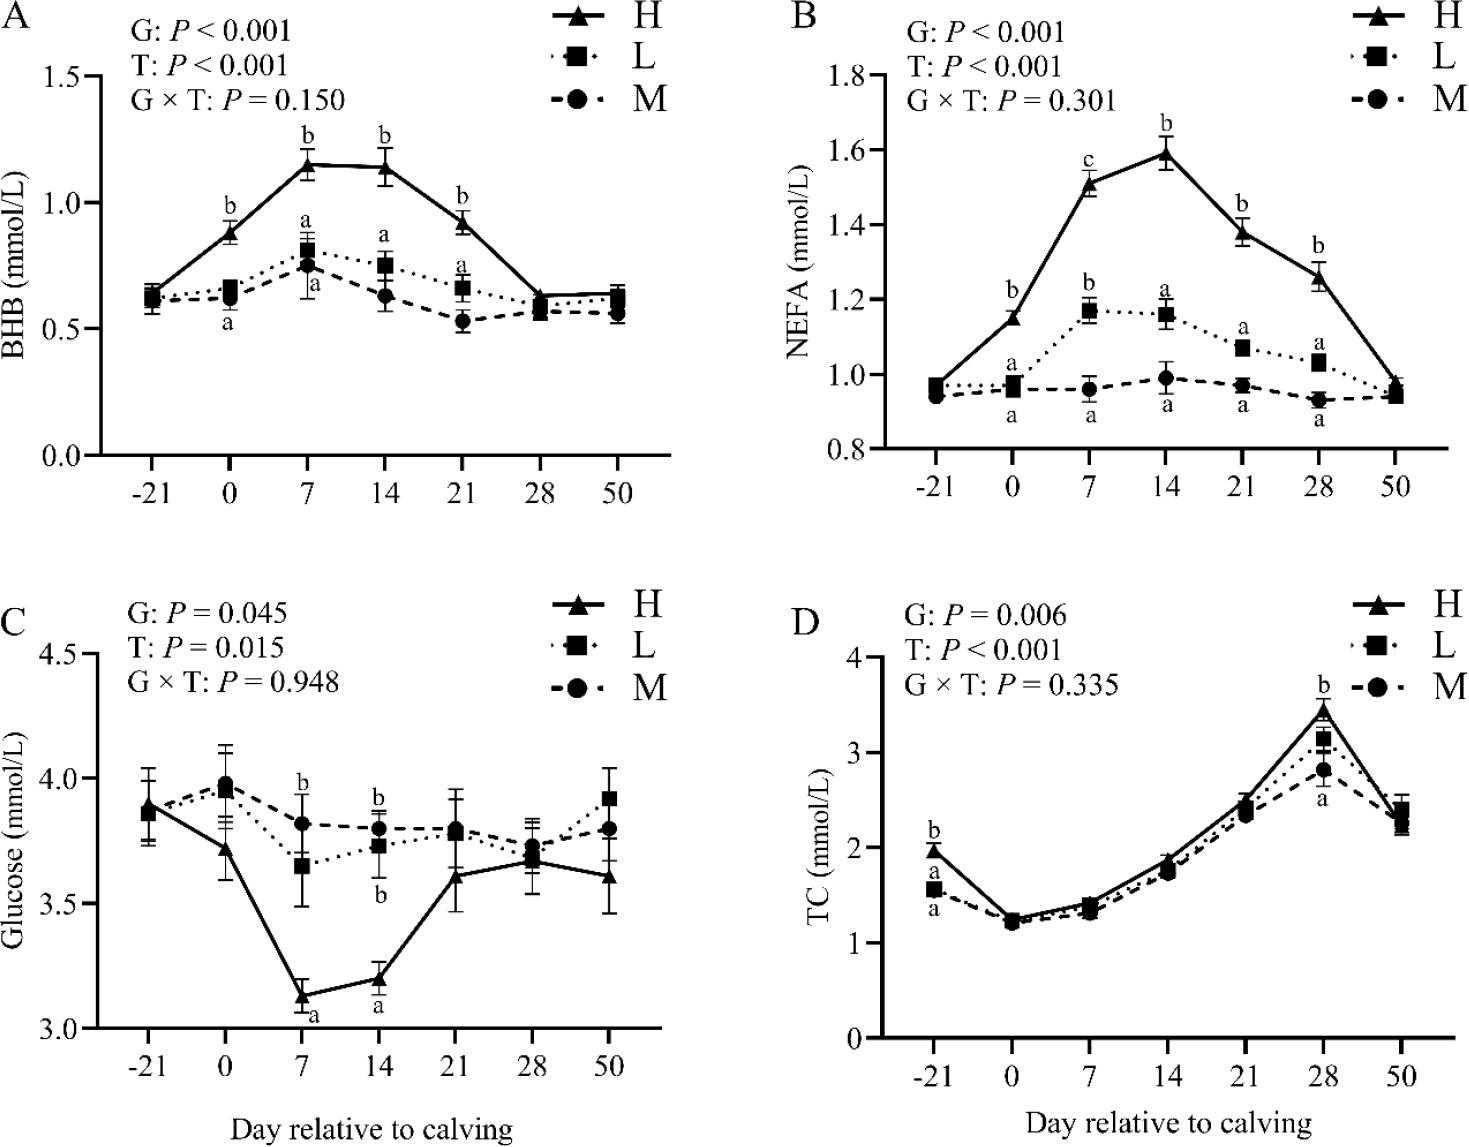
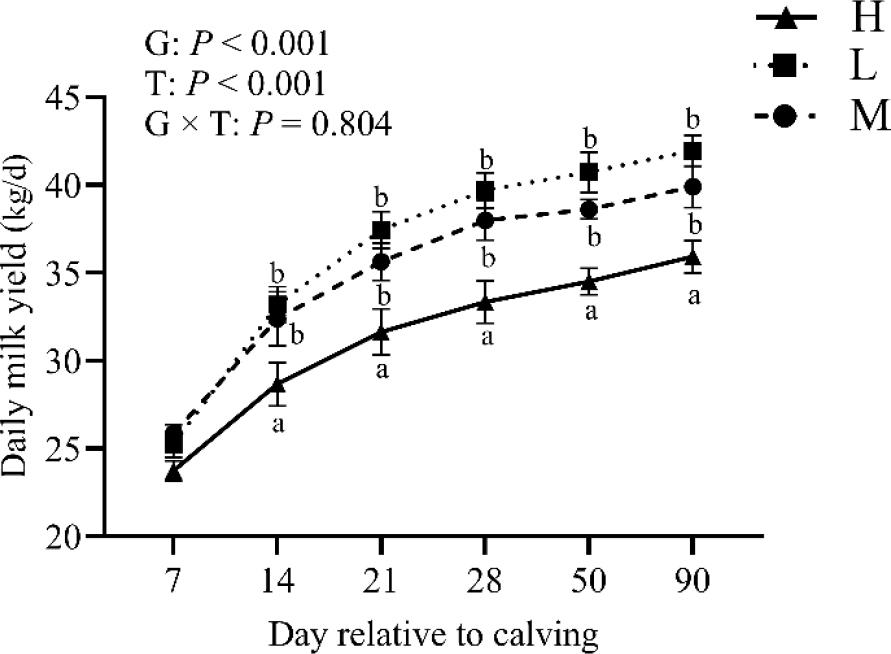
Fig. 3.
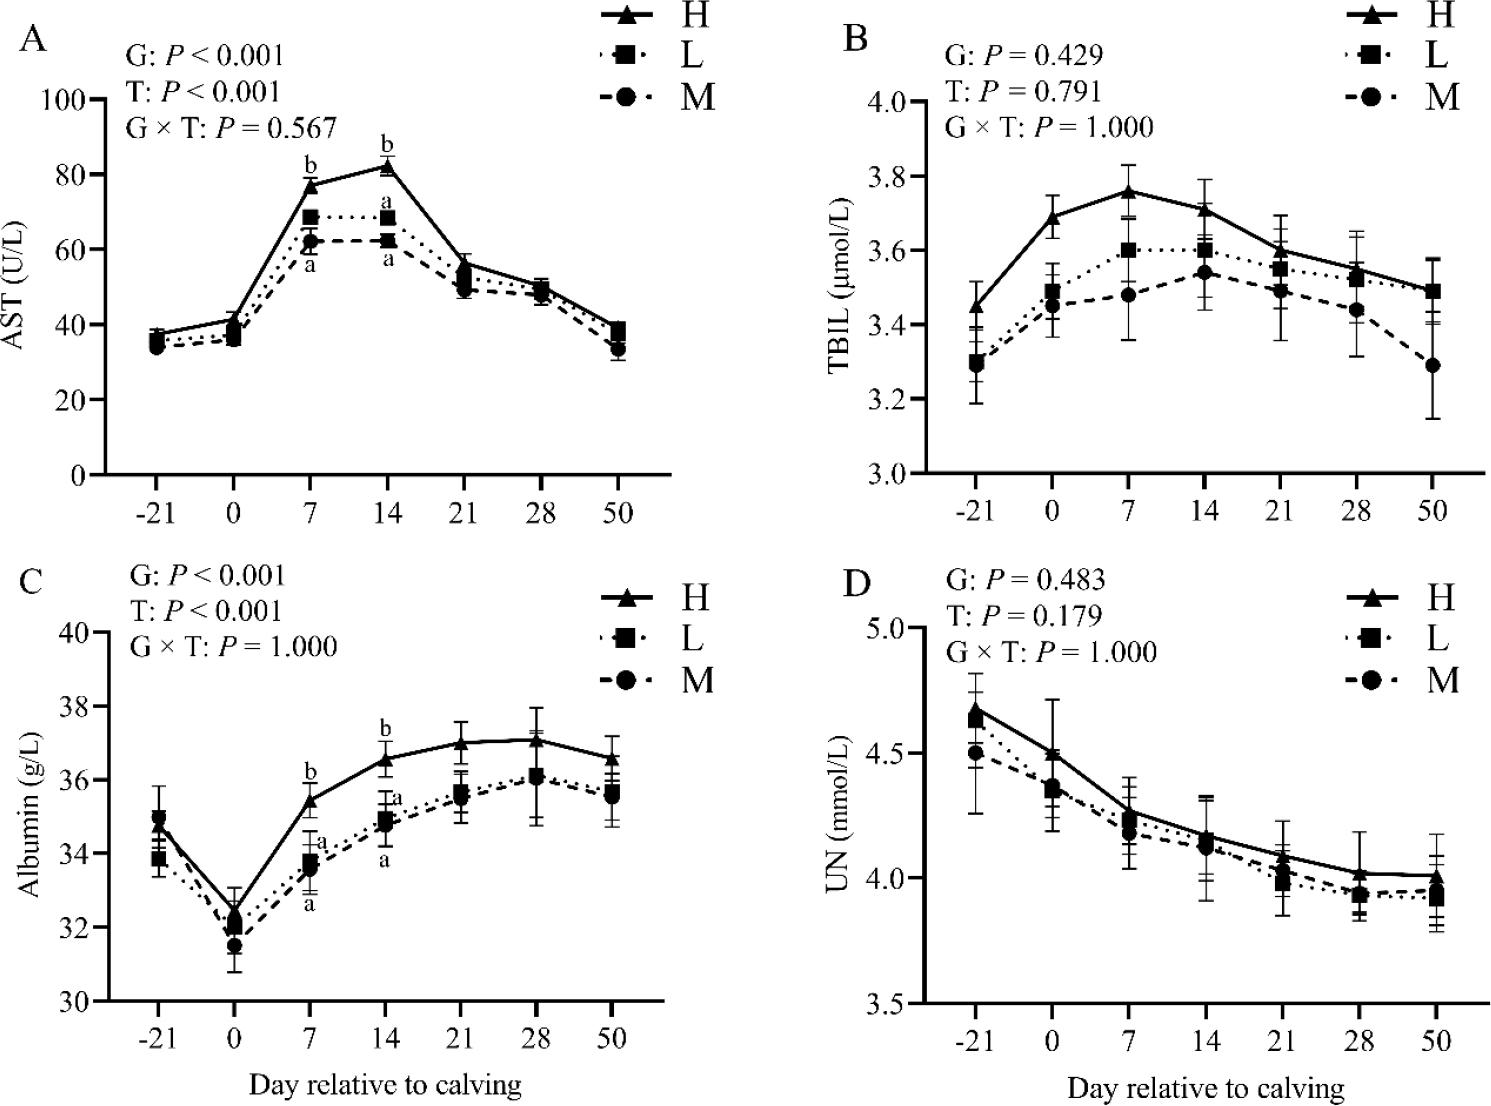
Fig. 4.
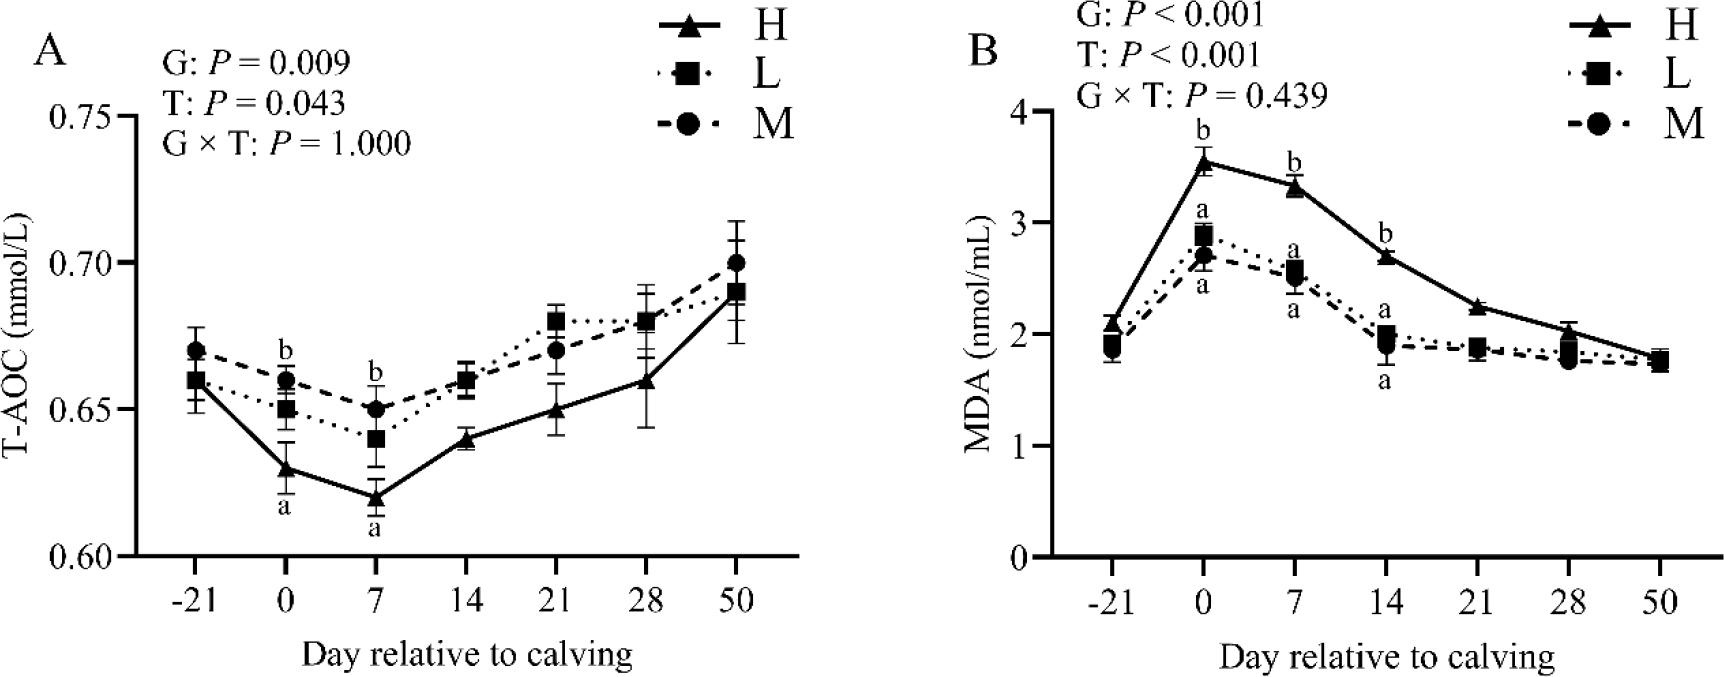
Fig. 5.
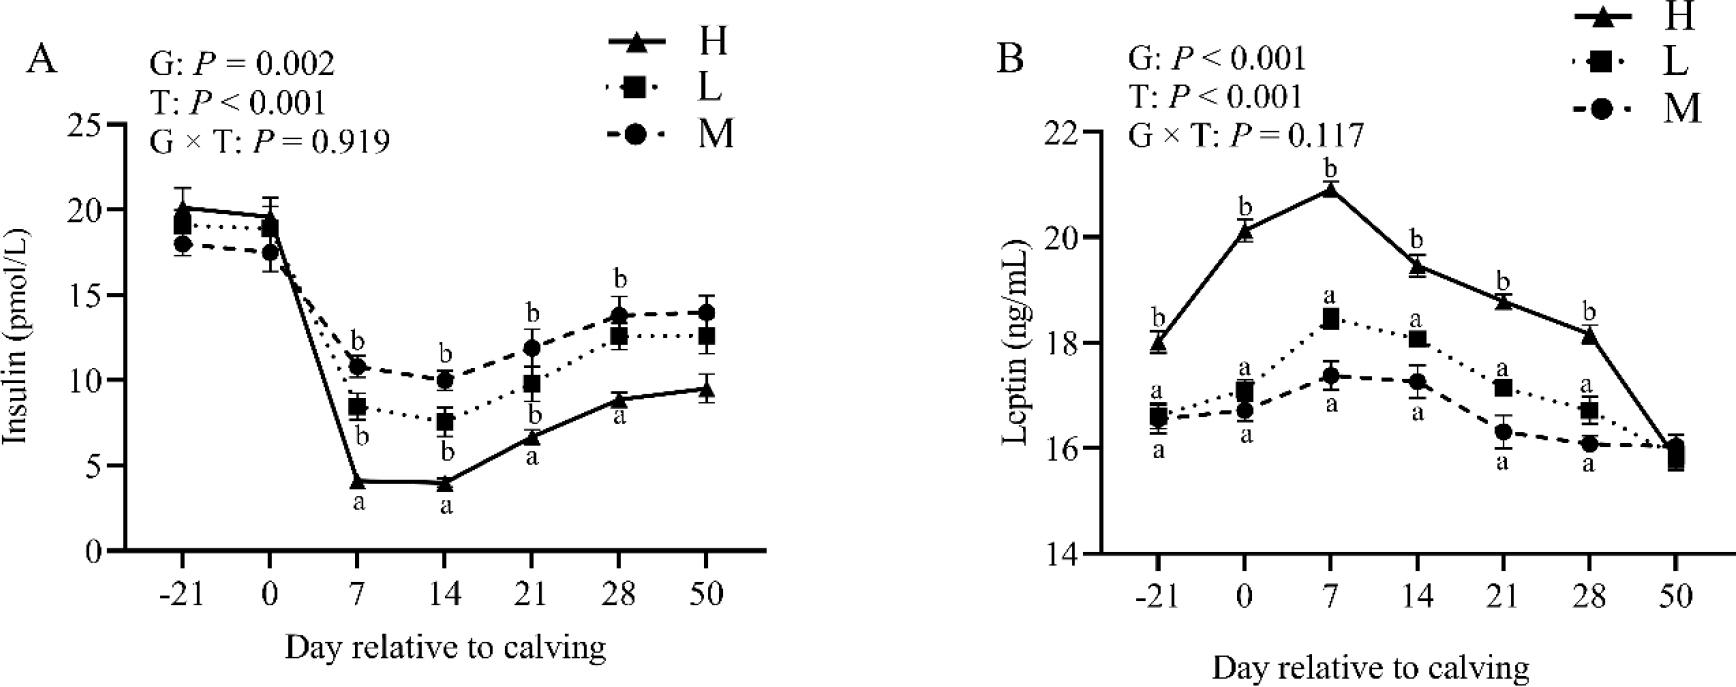
Fig. 6.
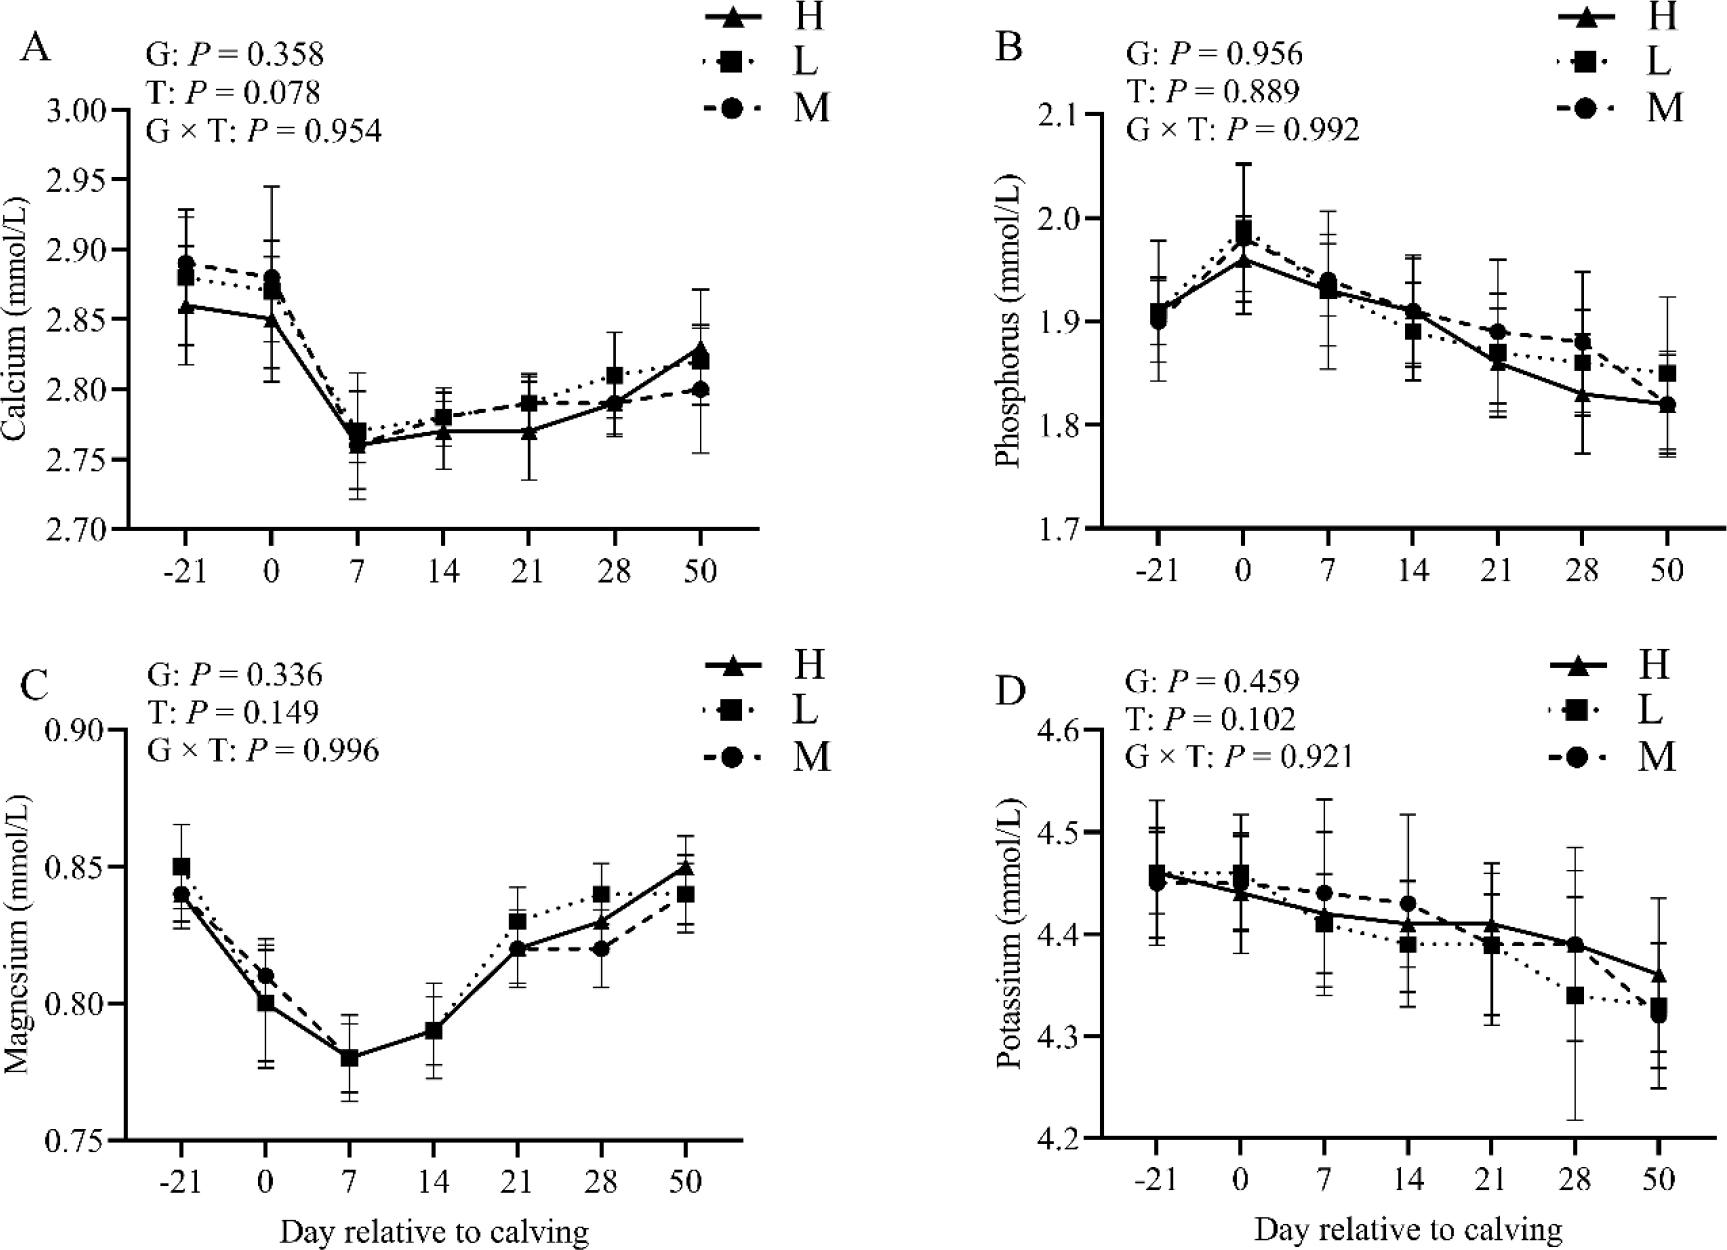
Fig. 7.
Prevalence of disease in three groups of dairy cows
| Condition | Percentage affected per group | ||
|---|---|---|---|
| M (n = 40) | L (n = 52) | H (n = 64) | |
| Ketosis | 12.5 (5/40)a | 42.3 (22/52)b | 60.93 (39/64)b |
| Mastitis | 15 (6/40)a | 17.3 (9/52)a | 37.5 (24/64)b |
| Retained placenta | 7.5 (3/40)a | 9.62 (5/52)a | 34.38 (22/64)b |
| Milk fever | 2.5 (1/40) | 3.84 (2/52) | 6.25 (4/64) |
| Displaced abomasum | 0a | 1.92 (1/52) | 14.06 (9/64)b |
| Metritis | 5 (2/40)a | 13.46 (7/52) | 25 (16/64)b |
| Lameness | 10 (4/40) | 15.38 (8/52) | 15.63 (10/64) |