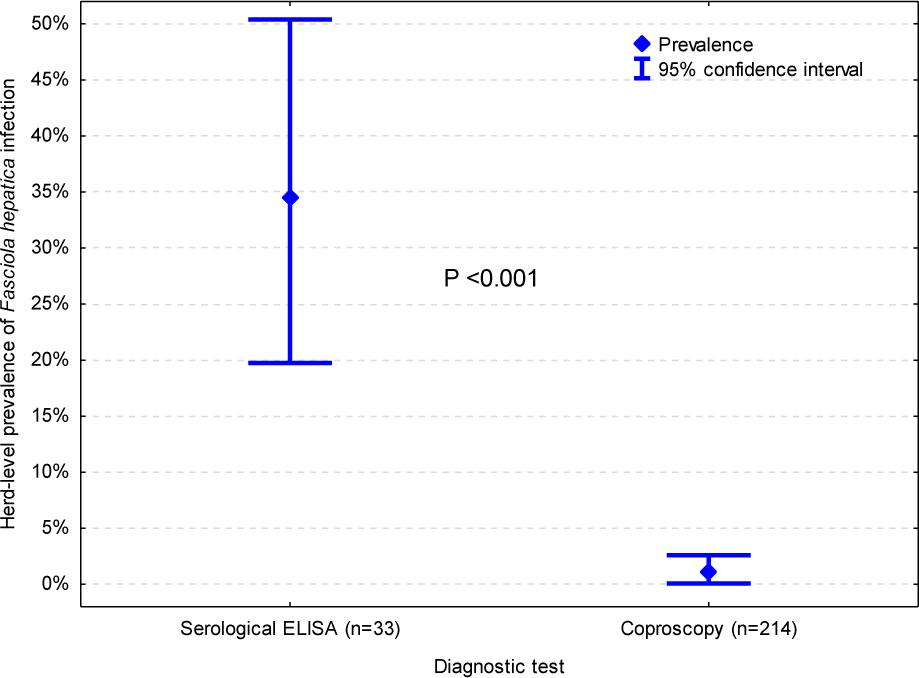
Fig. 1.
Herds in which at least one goat positive for Fasciola hepatica in the MM3-SERO ELISA was found
| Herd | Number of adult goats in the herd | Sample size (sample fraction (%)) | Number of seropositive goats (weak/medium/strong infestation) | Within-herd seroprevalence (95% confidence interval) (%) |
|---|---|---|---|---|
| 1 | 158 | 153 (96.8) | 2 (2/0/0) | 1.3 (0.4–4.6) |
| 2 | 66 | 66 (100) | 1 (1/0/0) | 1.5 (0.3–8.1) |
| 3 | 62 | 62 (100) | 4 (4/0/0) | 6.5 (2.5–15.5) |
| 4 | 27 | 27 (100) | 3 (2/1/0) | 11.1 (3.9–28.1) |
| 5 | 36 | 35 (97.2) | 1 (1/0/0) | 2.9 (0.5–14.5) |
| 6 | 61 | 51 (83.6) | 1 (1/0/0) | 2.0 (0.4–10.3) |
| 7 | 22 | 22 (100) | 1 (1/0/0) | 4.6 (0.8–21.8) |
| 8 | 33 | 33 (100) | 1 (1/0/0) | 3.0 (0.5–15.3) |
| 9 | 48 | 48 (100) | 1 (1/0/0) | 2.1 (0.4–10.9) |
| 10 | 127 | 127 (100) | 1 (1/0/0) | 0.8 (0.1–4.3) |
| 11 | 58 | 44 (75.9) | 1 (0/1/0) | 2.3 (0.4–11.8) |
Geographical distribution of goat herds tested for Fasciola hepatica infection
| Province | Number of herds tested serologically (% of 33 herds) | Number of seropositive herds / Number of tested herds | Number of herds tested coproscopically (% of 214 herds) |
|---|---|---|---|
| Małopolskie | 2 (6.1) | 2 / 2 | 35 (16.4) |
| Mazowieckie | 1 (3.0) | 0 / 1 | 33 (15.4) |
| Wielkopolskie | - | - | 19 (8.9) |
| Warmińsko-Mazurskie | 14 (42.4) | 3 / 14 | 16 (7.5) |
| Podkarpackie | - | - | 15 (7.0) |
| Śląskie | 1 (3.0) | 0 / 1 | 12 (5.6) |
| Pomorskie | 1 (3.0) | 0 / 1 | 11 (5.1) |
| Lubelskie | 4 (12.1) | 1 / 4 | 11 (5.1) |
| Łódzkie | - | - | 11 (5.1) |
| Lubuskie | - | - | 9 (4.2) |
| Kujawsko-Pomorskie | - | - | 9 (4.2) |
| Dolnośląskie | - | - | 8 (3.7) |
| Podlaskie | 5 (15.2) | 2 / 5 | 8 (3.7) |
| Świętokrzyskie | 3 (9.1) | 2 / 3 | 6 (2.8)* |
| Zachodniopomorskie | 2 (6.1) | 1 / 2 | 6 (2.8) |
| Opolskie | - | 5 (2.3) |
The analysis of risk factors for herd-level seropositivity for Fasciola hepatica infection in the goat population of Poland
| Risk factor | Category | Number of seropositive herds/Number of herds in the category (seroprevalence (%)) | P-value | Odds ratio (95% confidence interval) |
|---|---|---|---|---|
| Herd size | Small | 2 / 12 (16.7) | 0.291 | - |
| Medium | 7 / 17 (41.2) | |||
| Large | 2 / 4 (50.0) | |||
| Grazing on the pasture | Yes | 9 / 31 (29.0) | 0.104 | 0.08 (0.01–1.9) |
| No | 2 / 2 (100) | |||
| Access to water pools on the pasture | Yes | 3 / 8 (37.5) | 0.999 | 1.28 (0.24–6.7) |
| No | 8 / 25 (32.0) | |||
| Contact with sheep on the farm | Yes | 4 / 10 (40.0) | 0.696 | 1.52 (0.33–7.2) |
| No | 7 / 23 (30.4) | |||
| Contact with cattle on the farm | Yes | 1 /6 (16.7) | 0.637 | 0.34 (0.04–3.3) |
| No | 10 / 27 (37.0) |