
Table 1.
Composition of the total mixed ration (TMR) and dry mass (DM) daily feed ration for lactating cows
| Dose component | Amount per cow, daily | |
|---|---|---|
| kg TMR | kg DM | |
| Maize silage | 25.0 | 8.8 |
| Haylage | 8.0 | 3.2 |
| Ensiled brewery spent grain | 8.0 | 2.7 |
| Wheat straw | 0.8 | 0.7 |
| Ensiled maize grain | 2.5 | 1.7 |
| Ground barley grain | 1.5 | 1.3 |
| Ground triticale grain | 1.5 | 1.3 |
| Ground rapeseed | 2.7 | 2.2 |
| Extracted soyabean meal | 2.0 | 1.7 |
| Glycerine | 0.3 | 0.24 |
| Vitamin and mineral mixture | 0.2 | 0.18 |
| Sodium bicarbonate | 0.2 | 0.2 |
| Calcium carbonate | 0.05 | 0.05 |
| Total | 52.75 | 24.27 |
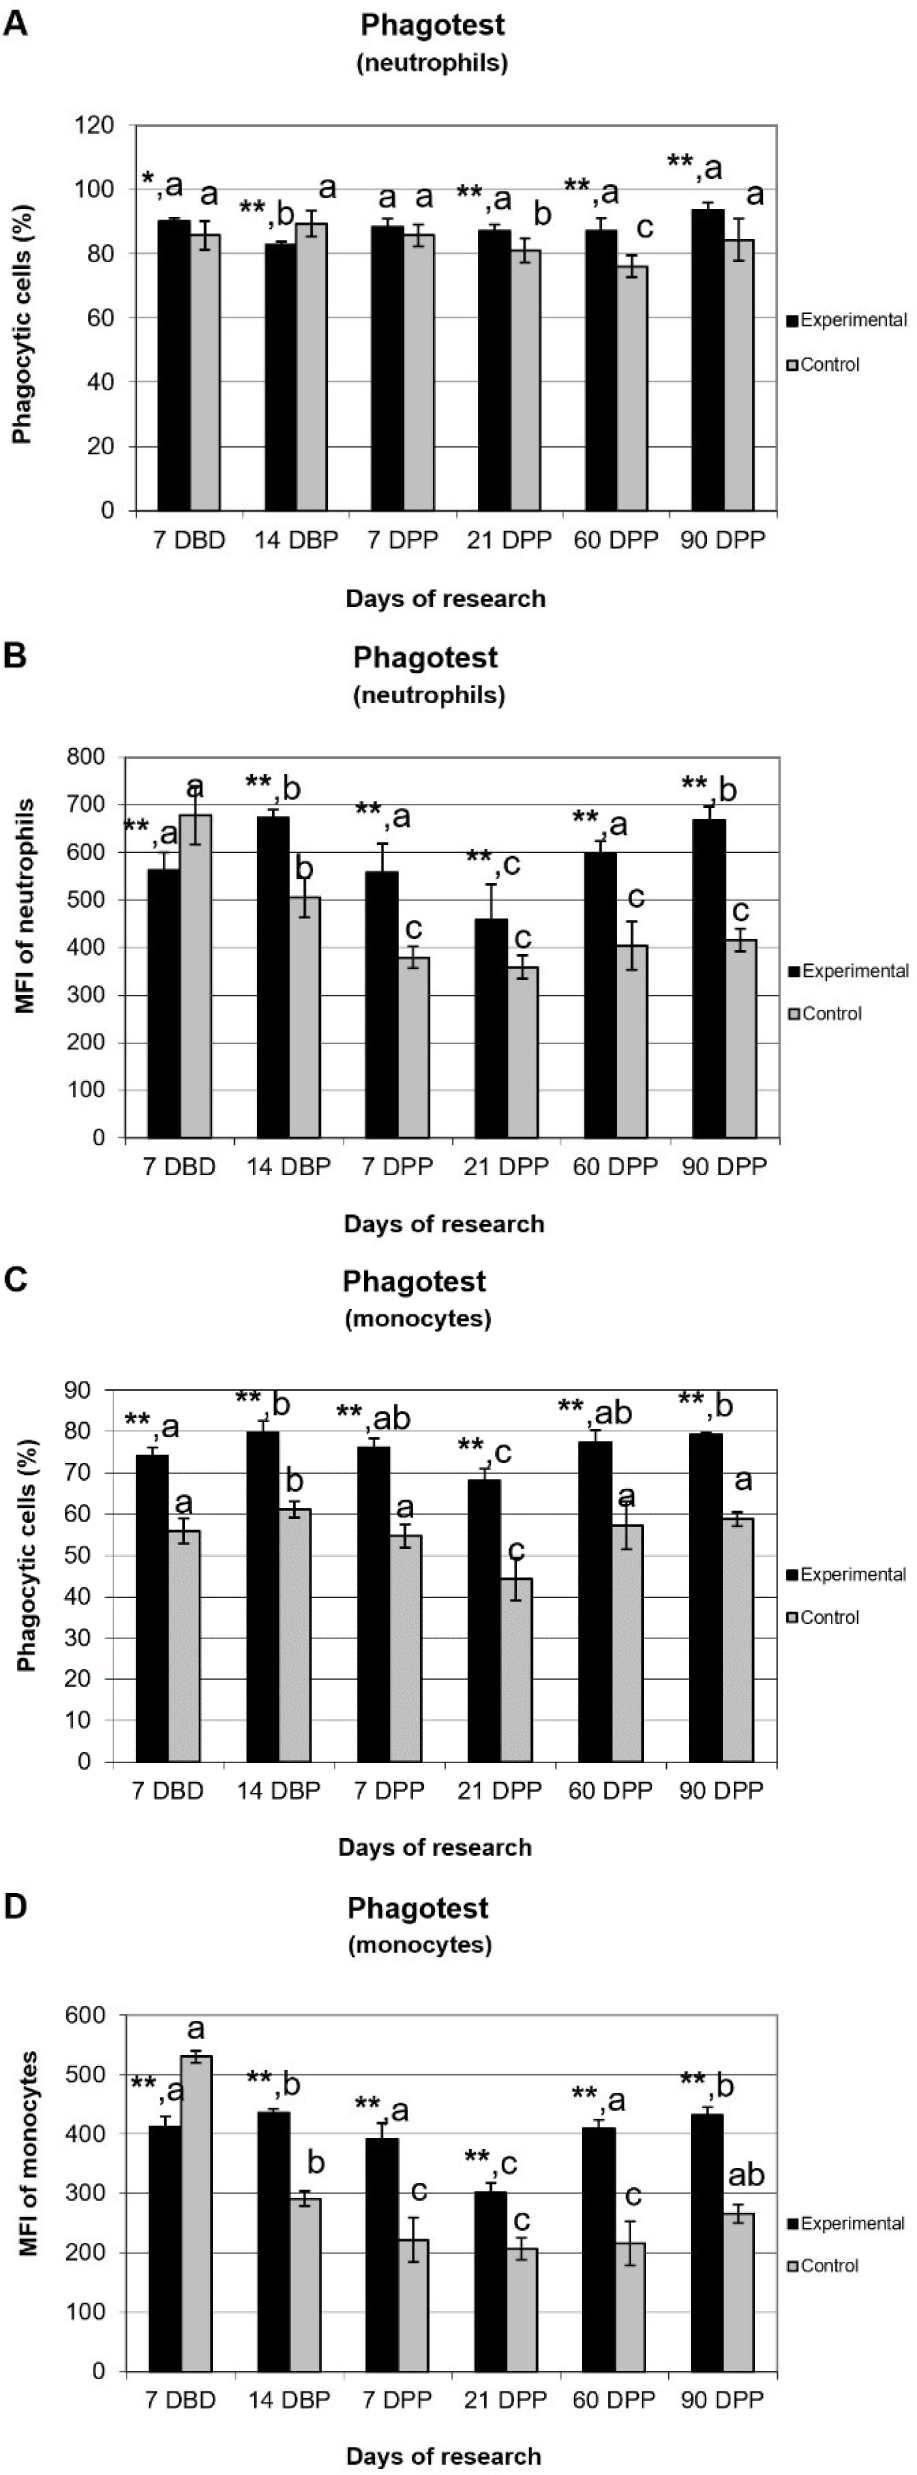
Fig. 1.
Cytometric analysis of phagocytosis activity of neutrophils (A and B) and monocytes (C and D) in the peripheral blood of cows at various periods of lactation (mean ± standard error of the mean). DBD – day before drying; DBP – day before parturition; DPP – day postpartum; Experimental – cows provided with probiotic (n = 10); Control – cows without probiotic (n = 10); Phagocytic cells (%) – percentage of neutrophils and monocytes that had engulfed bacteria; MFI – mean fluorescence intensities expressing individual cellular phagocytic activity (number of bacteria per cell). Statistical significance – * p ≤ 0.05; ** p ≤ 0.01 with respect to the control; a–c – significant differences between the results for the material collected at different times in the group (P-value < 0.01)
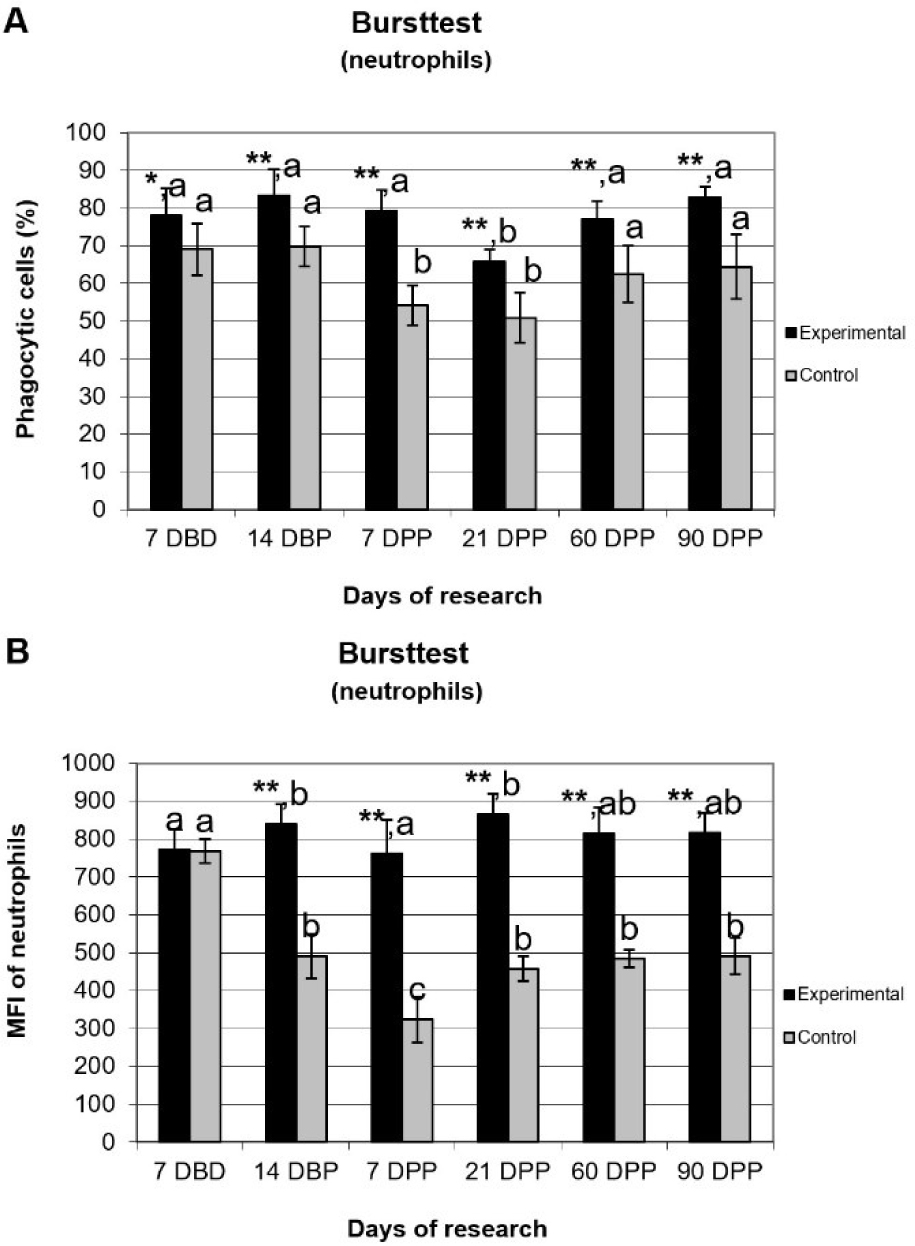
Fig. 2.
Cytometric analysis of oxidative burst activity of neutrophils (A and B) in the peripheral blood of cows at various periods of lactation (mean ± standard error of the mean). DBD – day before drying; DBP – day before parturition; DPP – day postpartum; Experimental – cows provided with probiotic (n = 10); Control – cows without probiotic (n = 10); Phagocytic cells (%) – the percentage of phagocytic cells that produced reactive oxygen substrates (measured by the conversion of DHR123 to R123); MFI – mean fluorescence intensities expressing enzymatic activity of phagocytic cells (measured by the amount of R123 per cell). Statistical significance – * p ≤ 0.05; ** p ≤ 0.01 with respect to the control; a–c – differences between the results for the material collected at different times in the group (P-value < 0.01)