
Fig. 1.
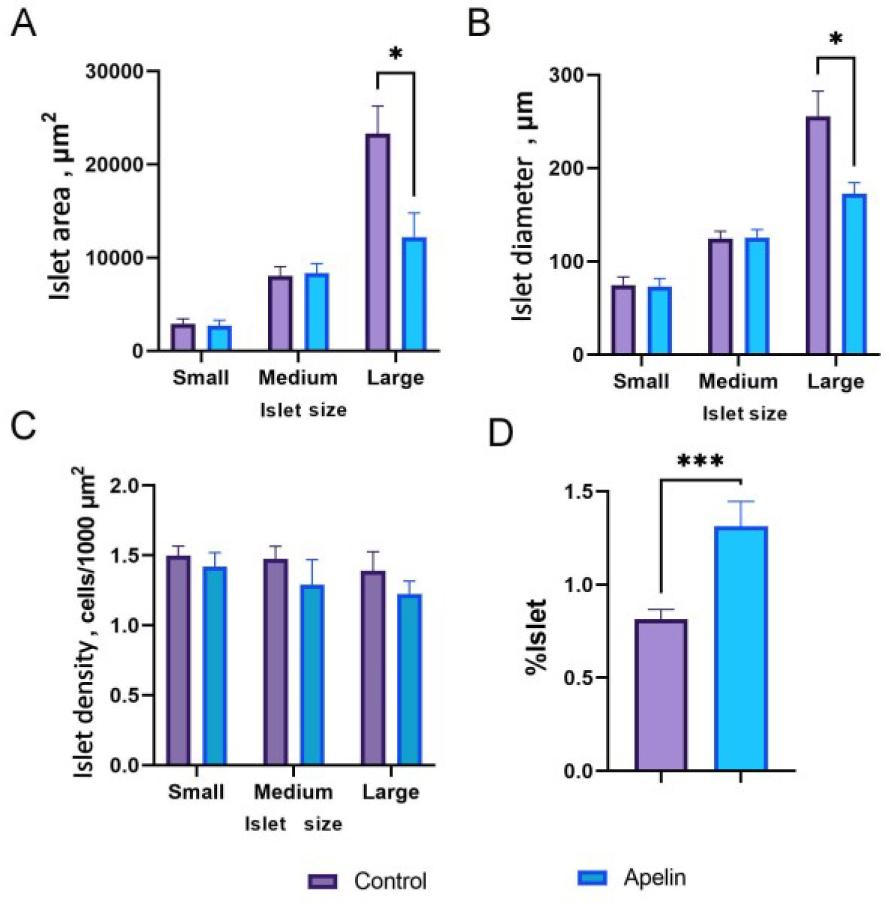
Fig. 2.
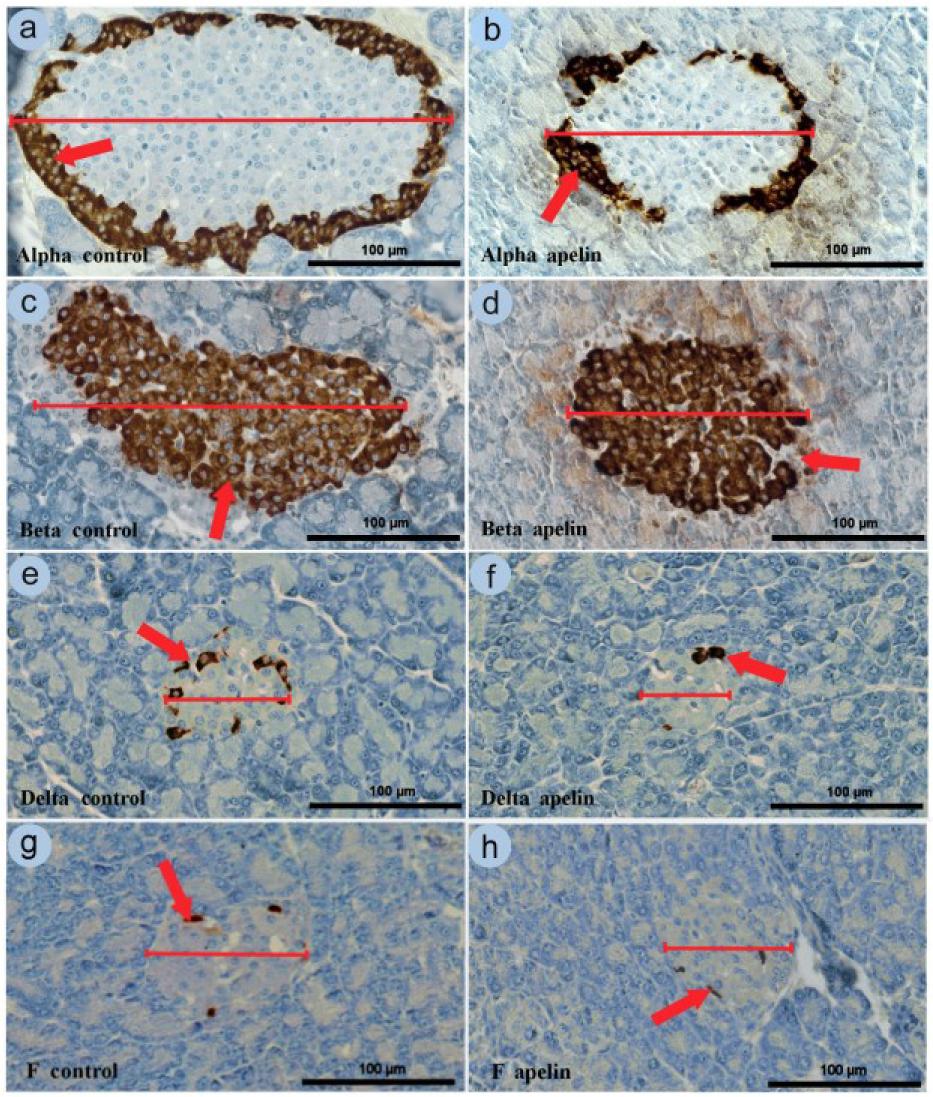
Fig. 3.
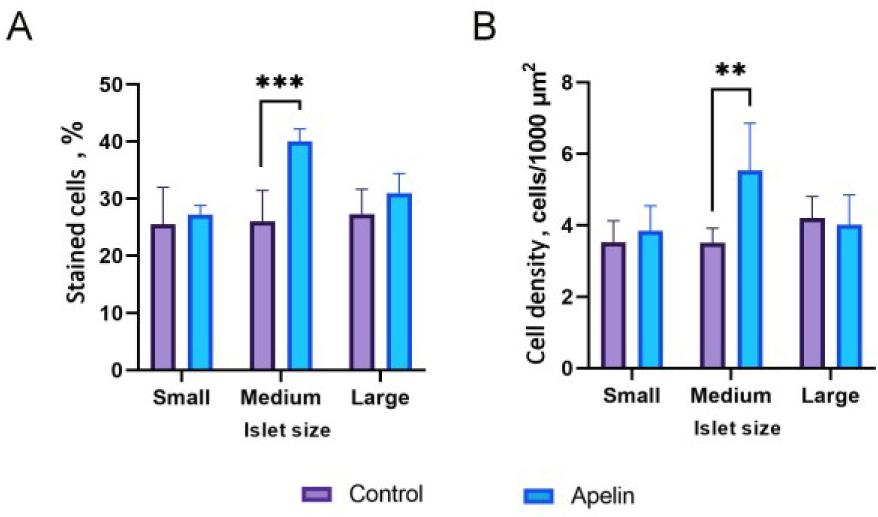
Fig. 4.
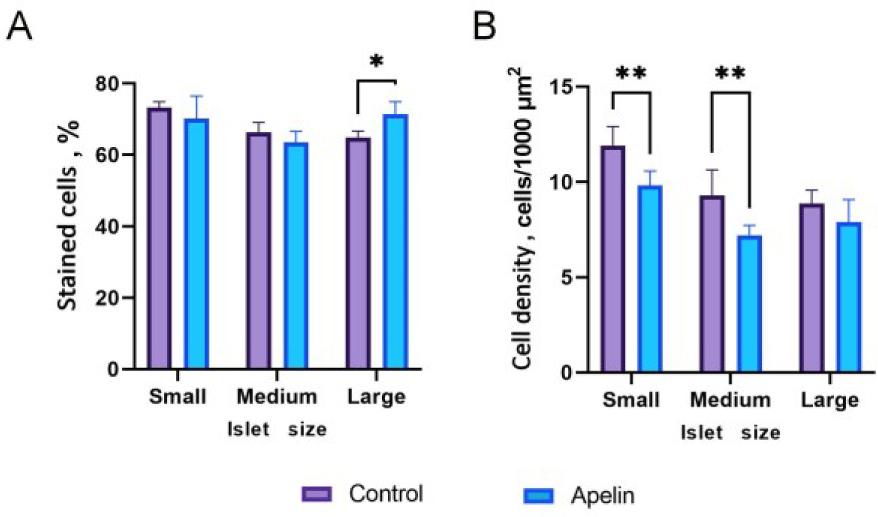
Fig. 5.
Fig. 6.
Fig. 7.
Fig. 8.
Primary and secondary antibodies used in the study
| Antibody | Host | Catalogue number | Dilution | Source |
|---|---|---|---|---|
| Primary antibody | ||||
| Anti-glucagon | Mouse | 14-9743-82 | 1 : 200 | ThermoFisher, Waltham, MA, USA |
| Anti-insulin | Mouse | MA5-12037 | 1 : 200 | ThermoFisher |
| Anti-somatostatin | Mouse | 14-9751-82 | 1 : 5000 | ThermoFisher |
| Anti-pancreatic polypeptide | Rabbit | ab272732 | 1 : 2000 | Abcam, Cambridge,UK |
| Anti-cleaved caspase 3 | Rabbit | AF7022 | 1 : 150 | Affinity Biosciences, Cincinnati, OH, USA |
| Anti-proliferating-cell nuclear antigen | Rabbit | AF0239 | 1 : 150 | Affinity Biosciences |
| Secondary antibody | ||||
| Anti-mouse/rabbit | Goat | DPVB-HRP | RTU | ImmunoLogic, Duiven, the Netherlands |