
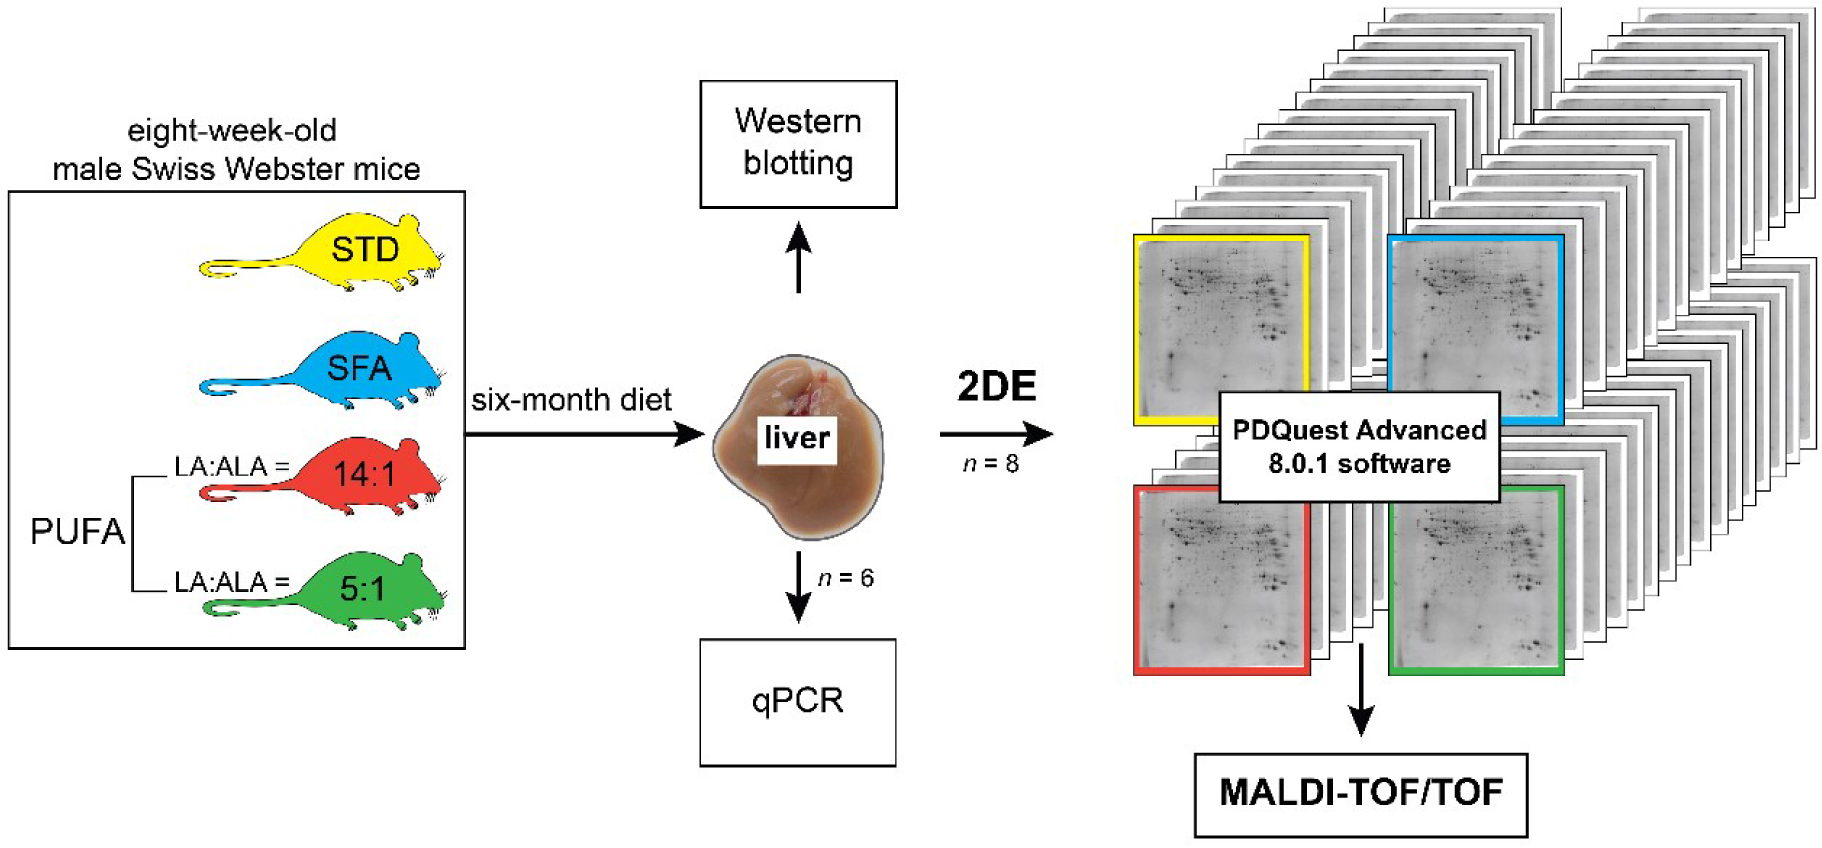
Fig. 1.
Experimental design to elucidate liver proteomic profile in mice fed four fat-varied diets. PUFA – polyunsaturated fatty acids; STD – standard diet; SFA – diet high in saturated fatty acids; 14 :1 – diet high in PUFA with this linoleic acid to α-linolenic acid ratio; 5 : 1 – diet high in PUFA with this linoleic acid to α-linolenic acid ratio; qPCR – real-time quantitative polymerase chain reaction; 2DE – two-dimensional electrophoresis. PDQuest Advanced 8.0.1 (Bio-Rad Laboratories, Hercules, CA, USA) software used for analysis of protein profiles. MALDI-TOF/TOF – matrix-assisted laser desorption/ionisation–time-of-flight tandem mass spectrometry
Table 1.
Western blot antibodies for identification of liver proteins in mice fed four fat-varied diets
| Target protein | UniProtKB accession number | Gene symbol | Molecular weight | Dilution | Host species | Conjugate | Supplier | Catalogue number |
|---|---|---|---|---|---|---|---|---|
| Primary antibody | ||||||||
| Ornithine aminotransferase | P29758 | Oat | 49 kDa | 1 : 500 | mouse | monoclonal | Santa Cruz Biotechnology Dallas, TX, USA | sc-376050 |
| Glyceraldehyde-3-phosphate dehydrogenase | P00355 | GAPDH | 36 kDa | 1 : 10,000 | rabbit | polyclonal | Abcam, Cambridge UK | ab190304 |
| Peroxiredoxin 6 | P30041 | PRDX6 | 25 kDa | 1 : 400 | mouse | monoclonal | Santa Cruz Biotechnology, Dallas, TX, USA | sc-101522 |
| Ferritin light chain | P02792 | FTL | 21 kDa | 1 : 1000 | rabbit | polyclonal | Abcam, Cambridge UK | ab69090 |
| Secondary antibody | ||||||||
| m-IgGκ BP-HRP | mouse | IgGκ light chain–binding protein conjugated to horseradish peroxidase (HRP) polyclonal horseradish peroxidase (HRP) conjugates | Santa Cruz Biotechnology, Dallas, TX, USA | sc-516102 | ||||
| Peroxidase AffiniPure Goat Anti-Rabbit IgG (H+L) | goat | Jackson ImmunoResearch, Ely, UK | 111-035-003 | |||||
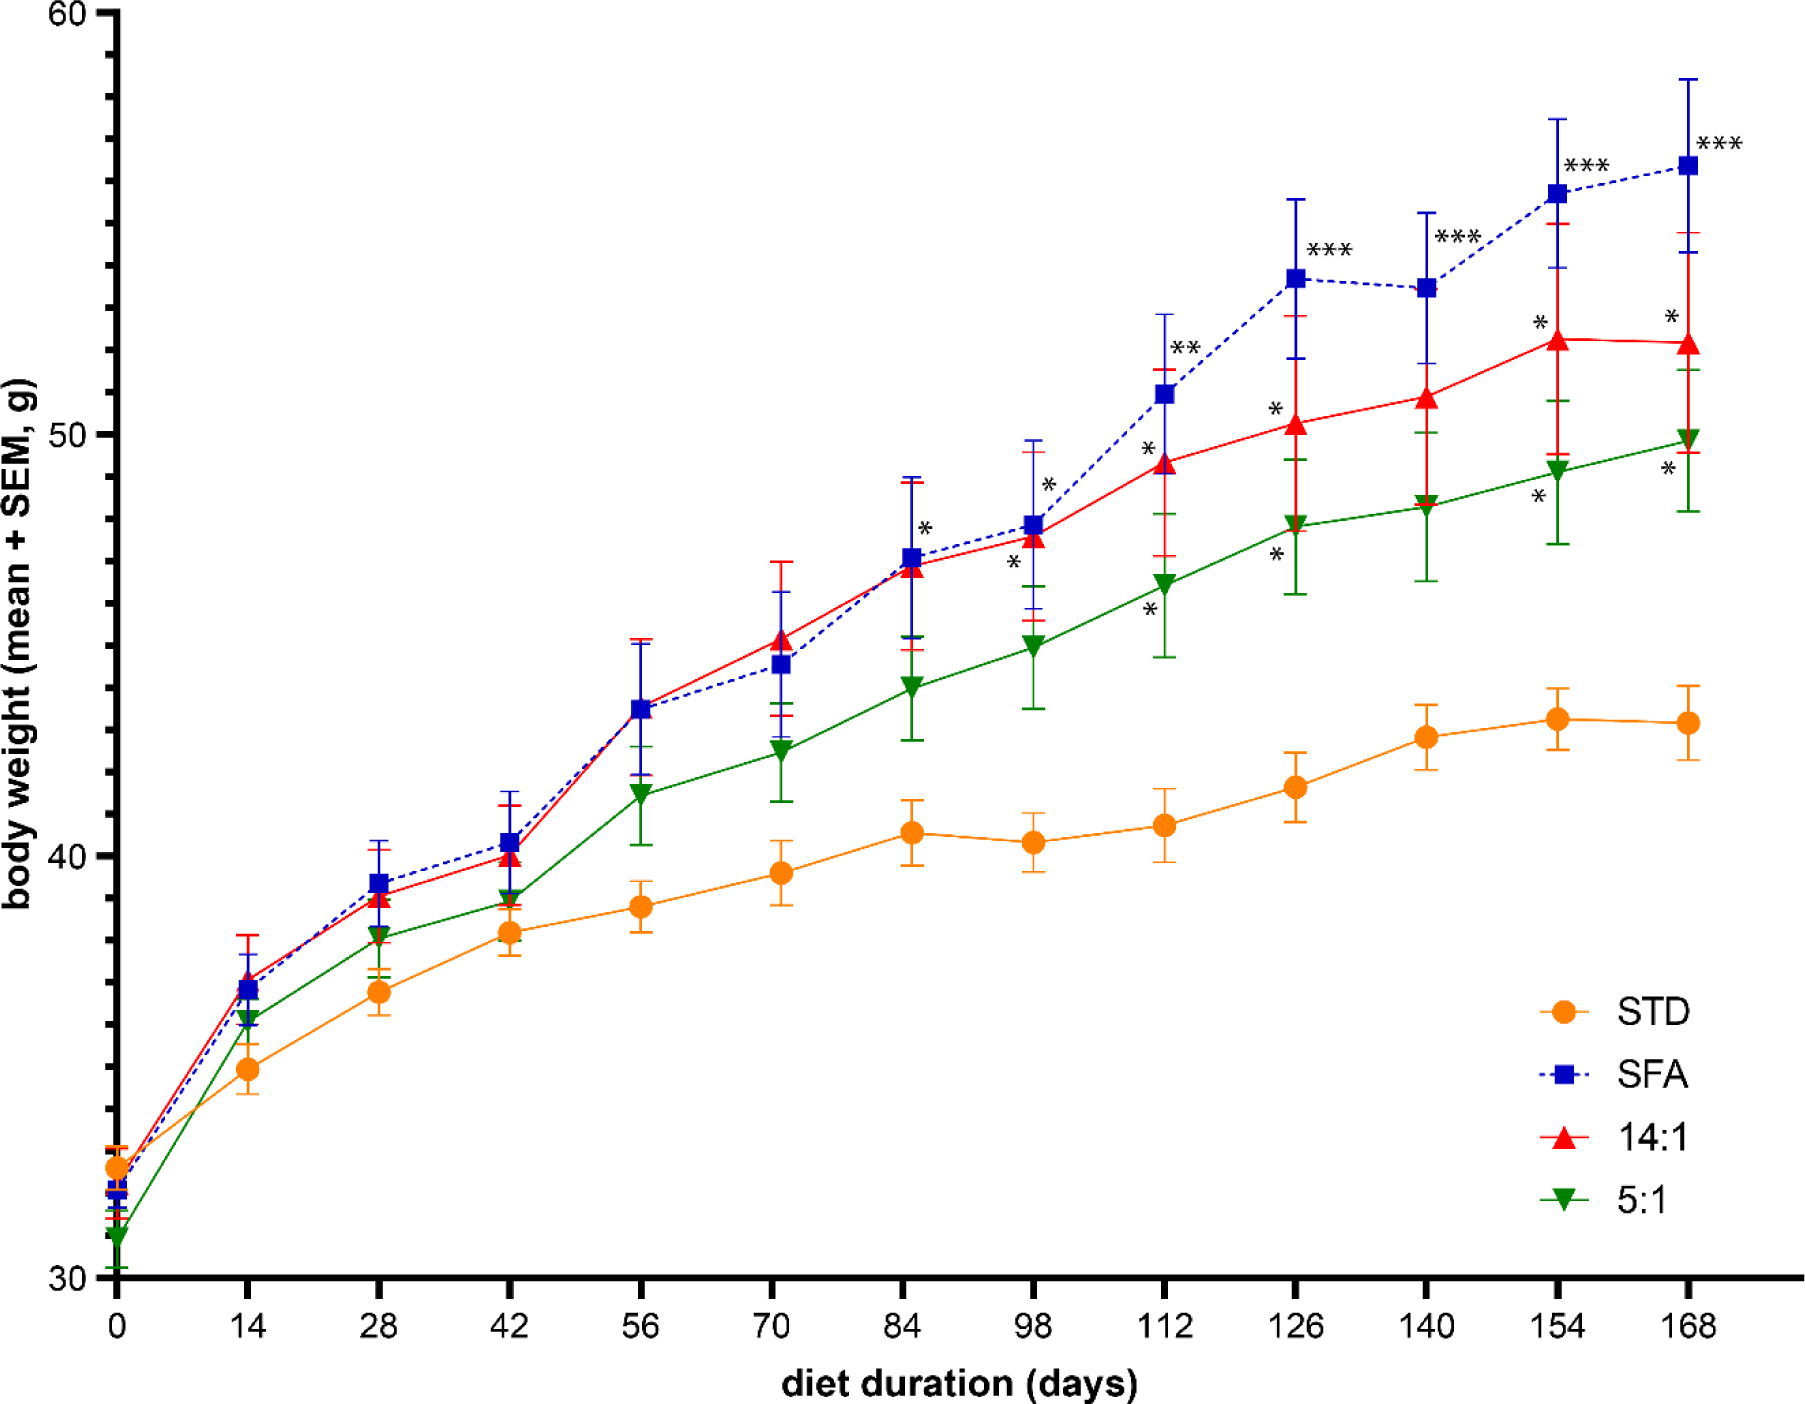
Fig. 2.
Effect on mice body weight of six months’ provision of experimental diets varied in fat content. Data are expressed as mean ± standard error of the mean, n = 10 mice per group. SEM – standard error of the mean; STD – standard diet; SFA – diet high in saturated fatty acids; 14 : 1 – diet high in polyunsaturated fatty acids (PUFA) with this linoleic acid to α-linolenic acid ratio; 5 : 1 – diet high in PUFA with this linoleic acid to α-linolenic acid ratio; * – significance difference at P-value < 0.05; ** – significant difference at P-value < 0.01; *** – significant difference at P-value < 0.001
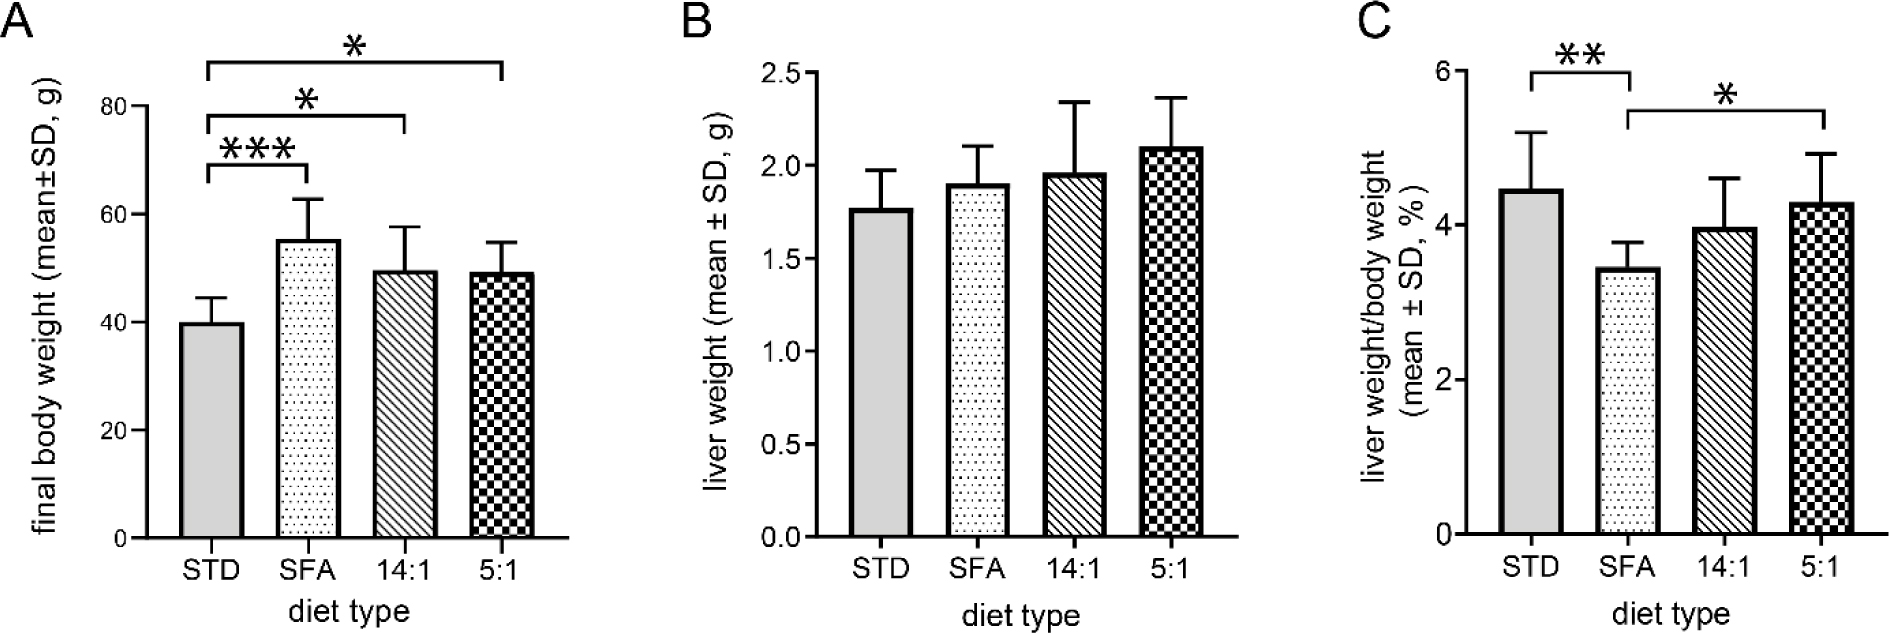
Fig. 3.
Final body weights of mice measured after six months’ provision of experimental diets varied in fat content and overnight fasting (A). Liver weights at the time of dissection (B). Ratios of liver weight to body weight (C). Data are expressed as mean ± standard deviation, n = 8 mice per group. STD – standard diet; SFA – diet high in saturated fatty acids; 14 : 1 – diet high in polyunsaturated fatty acids (PUFA) with this linoleic acid to α-linolenic acid ratio; 5 : 1 – diet high in PUFA with this linoleic acid to α-linolenic acid ratio; * – significant difference at P-value < 0.05; ** – significant difference at P-value < 0.01; *** – significant difference at P-value < 0.001
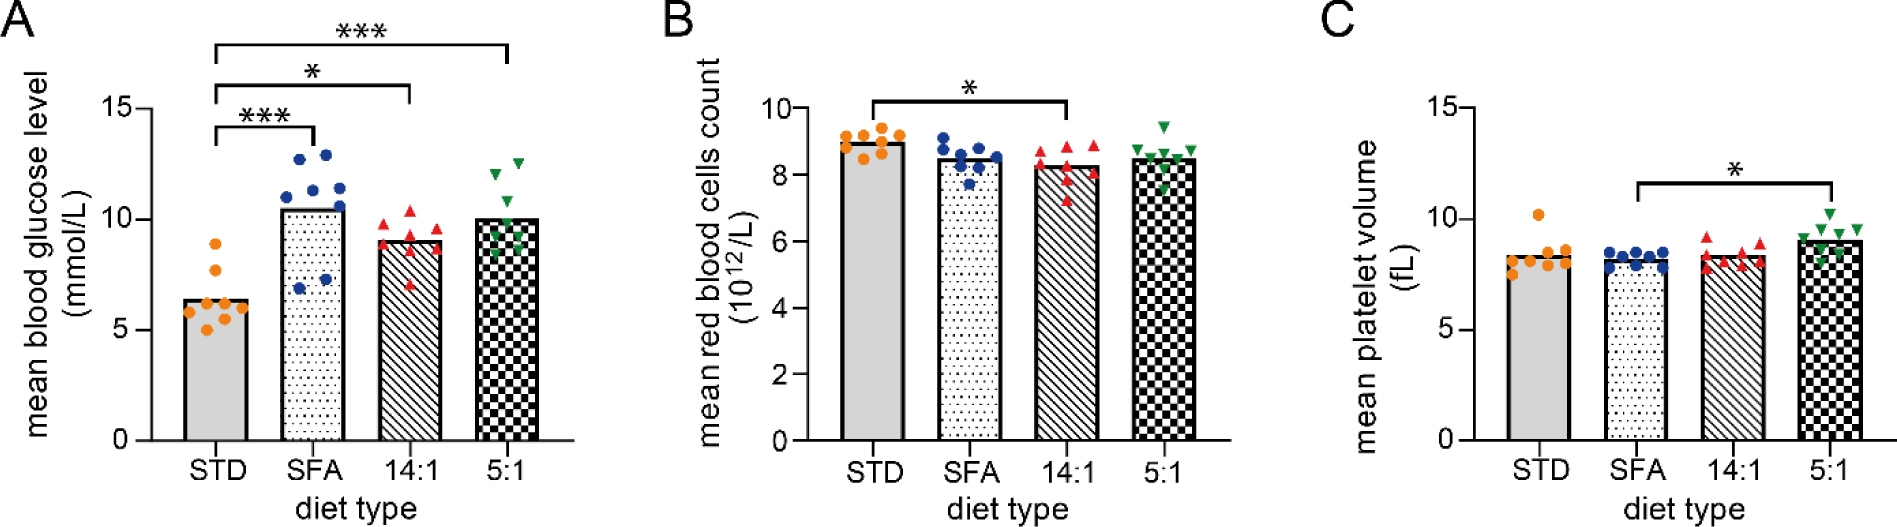
Fig. 4.
Blood parameters in mice after six months’ provision of experimental diets varied in fat content. Blood glucose level measured from tail blood (A). Mean red blood cell count measured from heart blood (B). Mean platelet volume measured in heart blood (C). STD – standard diet; SFA – diet high in saturated fatty acids; 14 : 1 – diet high in polyunsaturated fatty acids (PUFA) with this linoleic acid to α-linolenic acid ratio; 5 : 1 – diet high in PUFA with this linoleic acid to α-linolenic acid ratio; The plot shows the mean value, and the individual data points are presented in colours and shapes specific to each group; * – P-value < 0.05; ** – P-value < 0.01; *** – P-value < 0.001
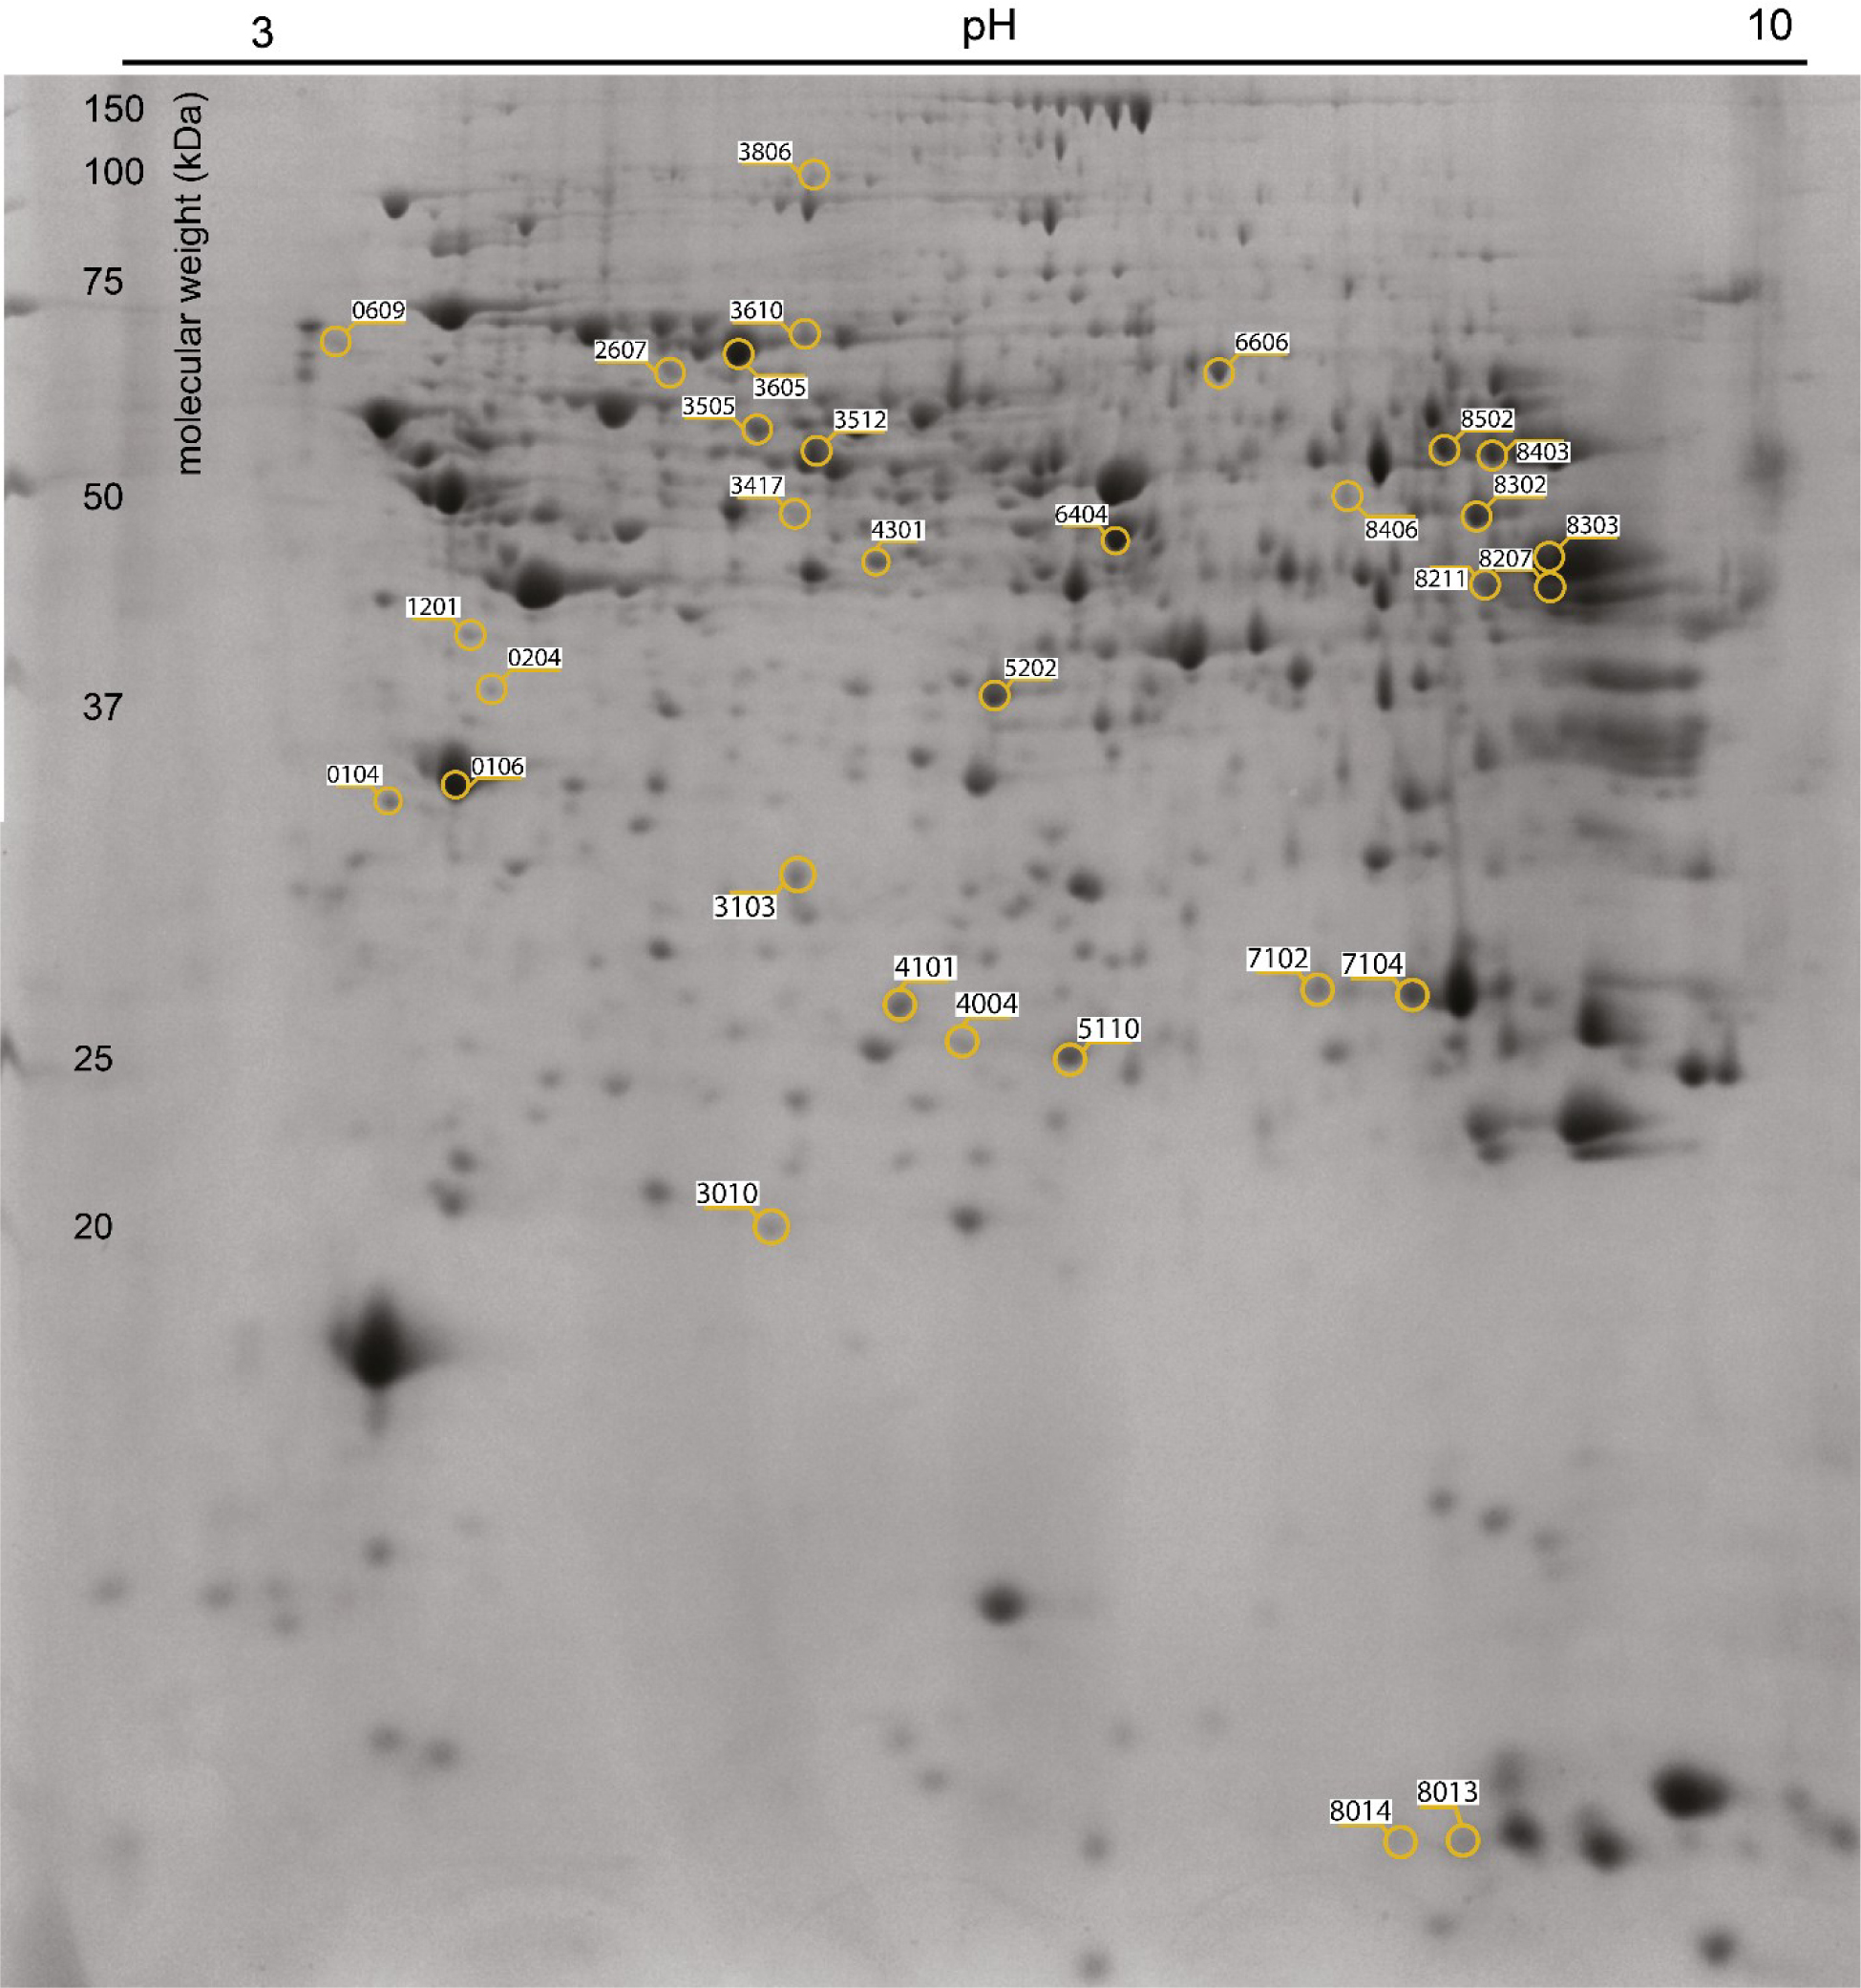
Fig. 5.
Differential murine liver protein spots after six months’ provision of experimental diets varied in fat contents. Spot numbers (SSP) and areas of protein spots with different expression levels between experimental groups correspond to the SSP number in Supplementary Table S3
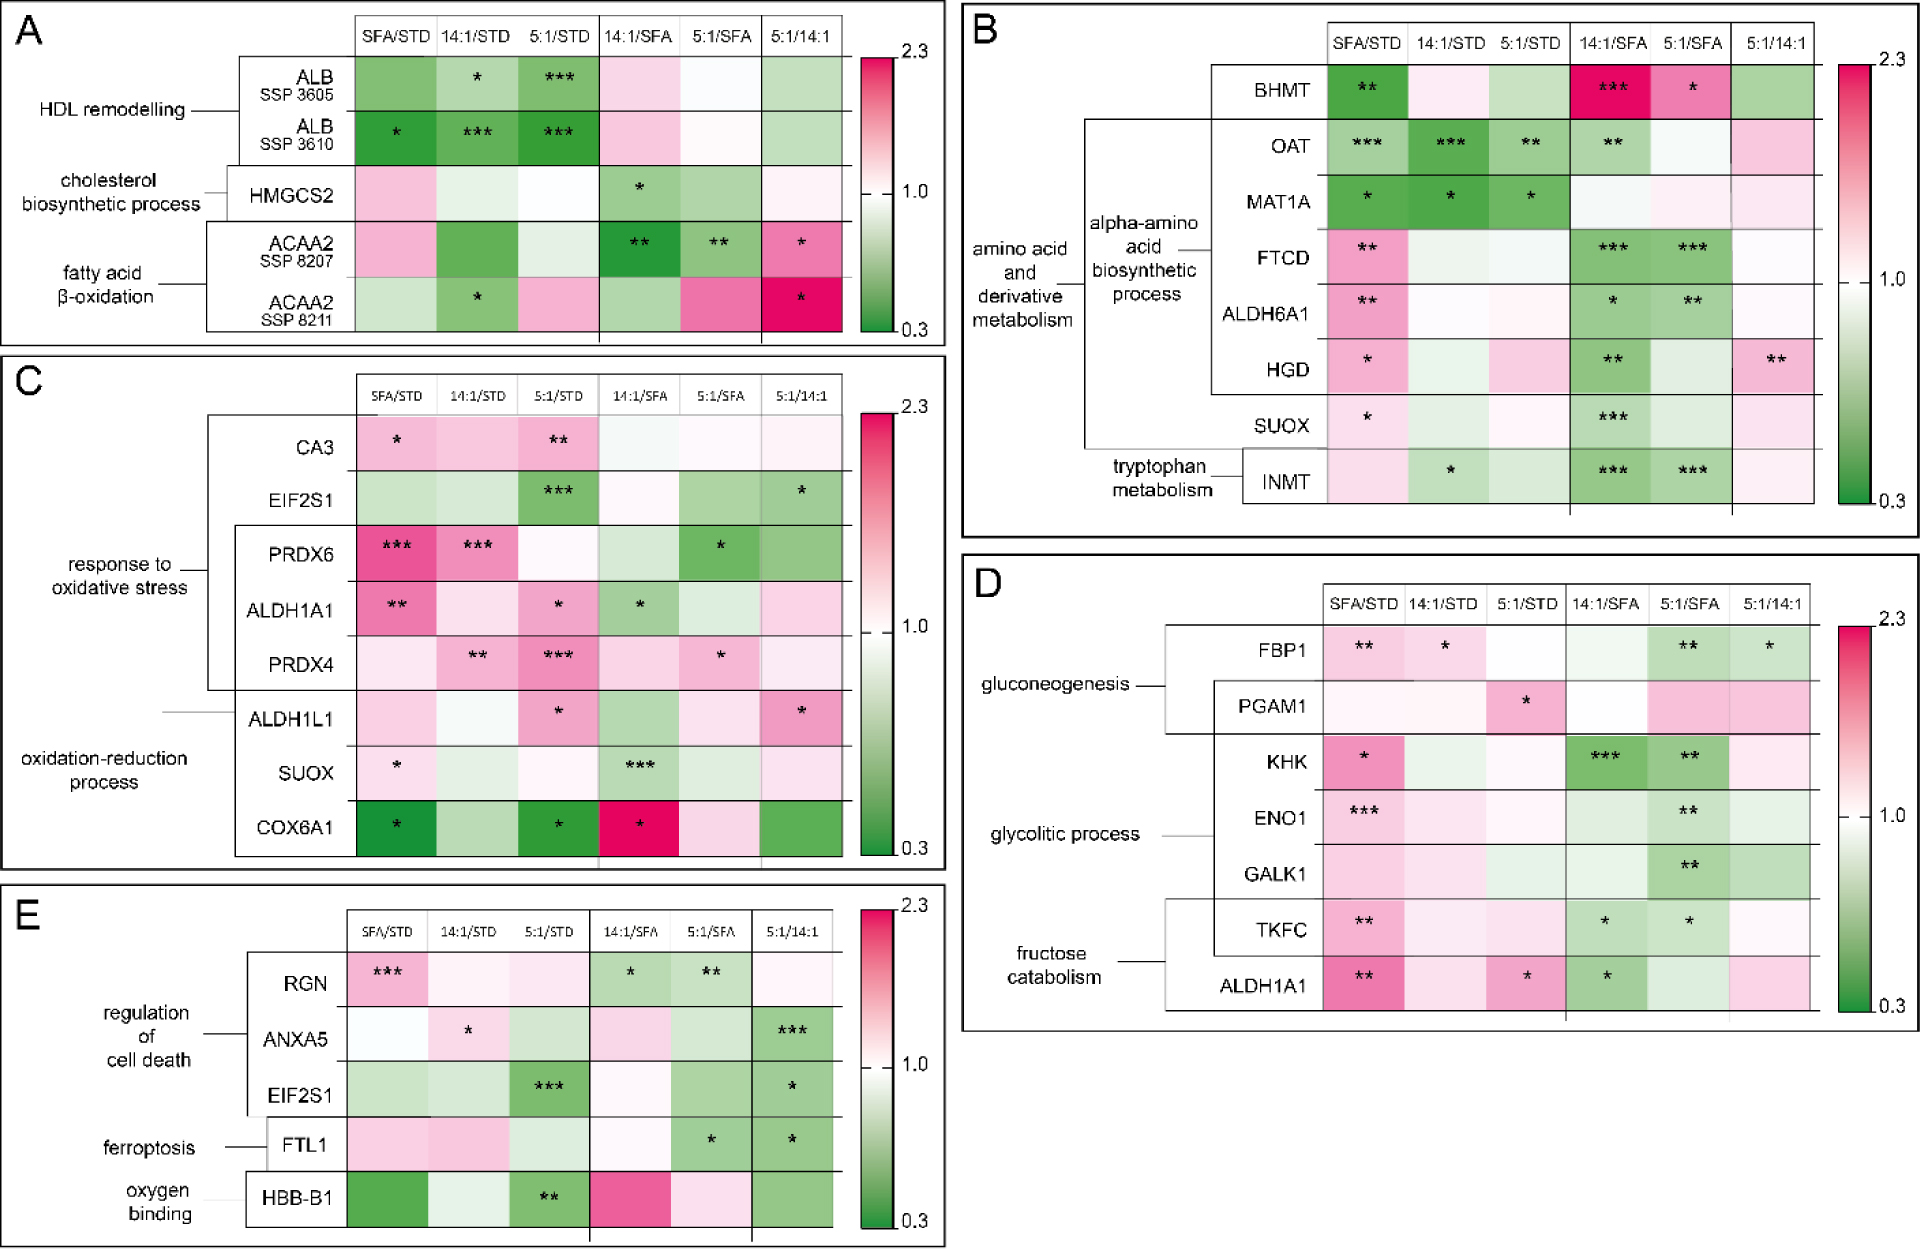
Fig. 6.
Differentially expressed murine liver proteins after six months’ provision of experimental diets varied in fat contents. The heatmap shows the increase (red) and the decrease (green) based on the comparison of the average spot intensity of the standard diet group (STD), group on a diet high in polyunsaturated fatty acids (PUFA) with 14 : 1 linoleic acid to α-linolenic acid ratio (14 : 1), group on a diet high in polyunsaturated fatty acids (PUFA) with 5 : 1 linoleic acid to α-linolenic acid ratio (5 : 1) and the saturated fatty acid diet (SFA) group. Lipid metabolism proteins (A); amino acid metabolism proteins (B); oxidative stress proteins (C); carbohydrate metabolism proteins (D); proteins regulating cell death pathway (E). HDL – high-density lipoprotein; ALB – albumin; HMGCS2 – 3-hydroxy-3-methylglutaryl-CoA synthase 2; ACAA2 – acetyl-CoA acyltransferase 2; BHMT – betaine-homocysteine S-methyltransferase; OAT – ornithine aminotransferase, mitochondrial; MAT1A – S-adenosylmethionine synthase isoform type-1; FTCD – formimidoyltransferase-cyclodeaminase; ALDH6A1 – aldehyde dehydrogenase family 6 member A1; HGD – homogentisate 1,2-dioxygenase; SUOX – sulfite oxidase, mitochondrial; INMT – indolethylamine N-methyltransferase; CA3 – carbonic anhydrase 3; EIF2S1 – eukaryotic translation initiation factor 2 subunit 1; PRDX6 – peroxiredoxin-6; ALDH1A1 – aldehyde dehydrogenase 1A1; COX6A1 – cytochrome c oxidase subunit 6A; FBP1 – fructose-1,6-bisphosphatase 1; PGAM1 – phosphoglycerate mutase 1; KHK – ketohexokinase; ENO1 – alpha-enolase; GALK1 – galactokinase; TKFC – triokinase/FMN cyclase; RGN – regucalcin; ANXA5 – annexin A5; FTL1 – ferritin light chain 1; HBB-B1 – haemoglobin subunit beta-1; * – significant difference at P-value < 0.05; ** – significant difference at P-value < 0.01; *** – significant difference at P-value < 0.001