
Table 1.
Characteristics of canine patients enrolled in the study
| Characteristics | Number of patients with different stages of tumour | |
|---|---|---|
| Without metastases (N0M0) | With metastases (N1, N0M1 or N1M1) | |
| G1 complex carcinoma | 2 | 0 |
| G2 complex carcinoma | 2 | 2 |
| G1 tubular carcinoma | 3 | 2 |
| G2 tubular carcinoma | 2 | 3 |
| osteosarcoma | 1 | 3 |
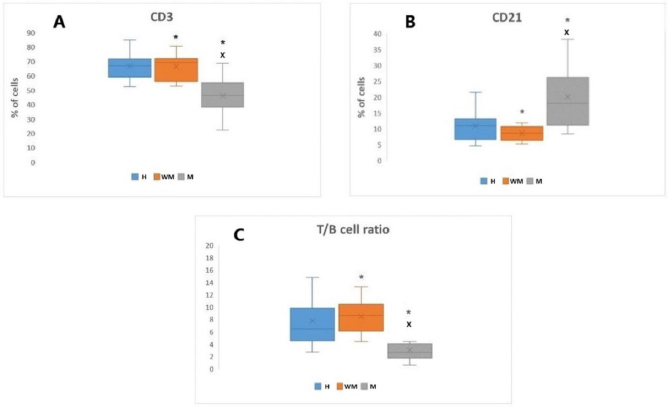
Fig. 1.
Frequencies of CD3+ T lymphocytes (A) and CD21+ B lymphocytes (B), and the CD3+/CD21+ lymphocyte ratio (C) in blood from canine mammary tumour patients and healthy controls. Mean and median percentages of cells in the control group (H), in the group without metastases (WM), and in the group with metastases (M). Boxes cover the 25th–75th percentiles and the median is shown as a line across the box
* – statistically significant difference (P-value < 0.05) between group WM and group M; X – statistically significant difference (P-value < 0.05) between groups WM or M and group H
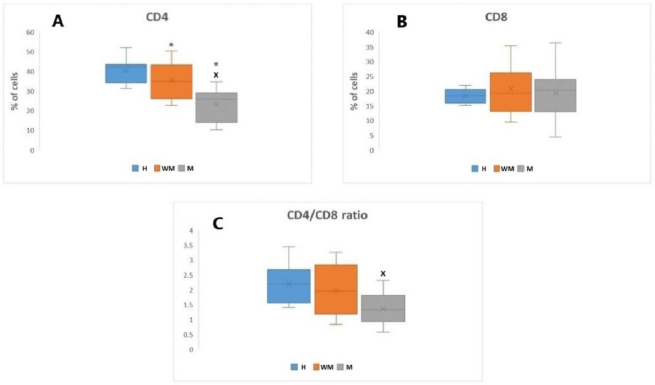
Fig. 2.
Frequencies of CD4+ T helper lymphocytes (A) and CD8+ cytotoxic T lymphocytes (B), and the CD4+/CD8+ lymphocyte ratio (C) in blood from canine mammary tumour patients and healthy controls. Mean and median percentages of cells in the control group (H), in the group without metastases (WM), and in the group with metastases (M). Boxes cover the 25th–75th percentiles and the median is shown as a line across the box
* – statistically significant difference (P-value < 0.05) between group WM and group M; X – statistically significant difference (P-value < 0.05) between groups WM or M and group H
Table 2.
Descriptive statistics of variables (full sample set n = 30)
| Variable | Health status | Mean | Median | SD | SE | Minimum | Maximum | ANOVA P-value | Tukey pairs | Tukey P-values |
|---|---|---|---|---|---|---|---|---|---|---|
| % CD3+ | without metastasis | 66.6 | 69.3 | 8.9 | 2.8 | 52.7 | 80.6 | 0.0003 | H vs M WM vs M | 0.001 0.0011 |
| metastasis | 46.1 | 46.4 | 14.7 | 4.7 | 22.3 | 68.9 | ||||
| healthy | 66.7 | 67.1 | 9.3 | 2.9 | 52.5 | 85.1 | ||||
| % CD21+ | without metastasis | 8.5 | 8.6 | 2.5 | 0.8 | 5.2 | 11.9 | 0.0018 | H vs M WM vs M | 0.0139 0.0021 |
| metastasis | 20.1 | 17.9 | 10.4 | 3.3 | 8.4 | 38.2 | ||||
| healthy | 10.9 | 10.9 | 4.9 | 1.6 | 4.6 | 21.4 | ||||
| % CD4+ | without metastasis | 35.5 | 34.9 | 9.5 | 3.0 | 22.6 | 50.4 | 0.0002 | H vs WM WM vs M | 0.0002 0.0061 |
| metastasis | 23.2 | 25.9 | 8.3 | 2.6 | 10.3 | 34.6 | ||||
| healthy | 40.4 | 42.3 | 6.2 | 2.0 | 31.4 | 52.0 | ||||
| % CD8+ | without metastasis | 20.7 | 19.4 | 8.0 | 2.5 | 9.5 | 35.4 | No statistically significant difference | ||
| metastasis | 19.3 | 20.3 | 9.0 | 2.8 | 4.5 | 36.4 | ||||
| healthy | 18.4 | 18.3 | 2.3 | 0.7 | 15.1 | 21.9 | ||||
| CD3+/CD21+ ratio | without metastasis | 8.5 | 8.6 | 2.8 | 0.9 | 4.4 | 13.3 | 0.0028 | H vs M WM vs M | 0.0125 0.0041 |
| metastasis | 3.0 | 2.7 | 2.1 | 0.7 | 0.6 | 8.1 | ||||
| healthy | 7.8 | 6.5 | 4.9 | 1.5 | 2.8 | 18.0 | ||||
| CD4+/CD8+ ratio | without metastasis | 1.9 | 1.9 | 0.9 | 0.3 | 0.8 | 3.3 | 0.0348 | H vs M | 0.03291 |
| metastasis | 1.4 | 1.3 | 0.5 | 0.2 | 0.6 | 2.3 | ||||
| healthy | 1.2 | 2.2 | 0.7 | 0.2 | 1.4 | 3.4 | ||||