
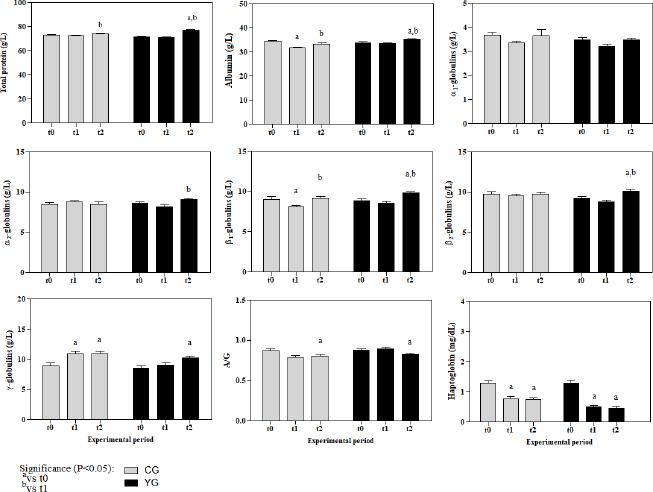
Fig. 1.
Feed ingredients and chemical analysis of total mixed rations provided to the experimental animals
| Feed ingredients (kg per day per head) | |
|---|---|
| BULL 100 11.11* | 0.50 |
| Corn gluten feed | 0.60 |
| Alfalfa hay | 1.00 |
| Corn | 2.00 |
| Dry pulp | 1.00 |
| Straw | 0.80 |
| Corn silage | 5.65 |
| Soybean meal | 0.30 |
| Total | 11.85 |
| Dry matter (%) | 57.17 |
| Chemical composition | |
| Crude protein (%) | 13.16 |
| Ethereal extract (%) | 3.11 |
| Fibre (%) | 14.98 |
| Ash (%) | 6.07 |
| Neutral detergent fibre (%) | 38.93 |
| Starch (%) | 32.52 |
| Ca (g) | 69.47 |
| P (g) | 24.94 |
Mean values ± standard error of the mean of studied parameters with statistical differences related to group, measured in the serum of bulls of the control group (CG) without yeast supplementation and the serum of bulls of the group given 5 g of Saccharomyces cerevisiae (YG)
| Serum parameters | Group | t0 | t1 | t2 |
|---|---|---|---|---|
| Total protein (g/L) | CG | 73.07 ± 0.45 | 72.40 ± 0.63 | 74.08 ± 0.40*** |
| YG | 71.47± 0.53 | 71.26 ± 0.51 | 76.91 ± 0.47*** | |
| Albumin (g/L) | CG | 34.46 ± 0.42 | 31.75 ± 0.34** | 33.41 ± 0.41** |
| YG | 33.84 ± 0.44 | 33.49 ± 0.34** | 35.20 ± 0.40** | |
| α1-globulins (g/L) | CG | 3.68 ± 0.12 | 3.35 ± 0.09 | 3.65 ± 0.25 |
| YG | 3.48 ± 0.08 | 3.19 ± 0.11 | 3.48 ± 0.08 | |
| α2-globulins (g/L) | CG | 8.52 ± 0.16 | 8.77 ± 0.12 | 8.47 ± 0.28 |
| YG | 8.66 ± 0.16 | 8.20 ± 0.18 | 9.09 ± 0.16 | |
| β1-globulins (g/L) | CG | 9.03 ± 0.38 | 8.14 ± 0.11 | 9.16 ± 0.21 |
| YG | 8.84 ± 0.25 | 8.54 ± 0.23 | 9.82 ± 0.19 | |
| β2-globulins (g/L) | CG | 9.78 ± 0.29 | 9.51 ± 0.28 | 9.77 ± 0.24 |
| YG | 9.21 ± 0.24 | 8.79 ± 0.21 | 10.15 ± 0.22 | |
| γ-globulins (g/L) | CG | 8.95 ± 0.51 | 10.89 ± 0.47** | 10.95 ± 0.37 |
| YG | 8.54 ± 0.34 | 9.05 ± 0.32** | 10.17 ± 0.36 | |
| A: G ratio | CG | 0.87 ± 0.02 | 0.79 ± 0.02*** | 0.80 ± 0.01 |
| YG | 0.88 ± 0.01 | 0.89 ± 0.01*** | 0.83 ± 0.01 | |
| Haptoglobin (mg/L) | CG | 1.28 ± 0.07 | 0.75 ± 0.08 | 0.74 ± 0.06 |
| YG | 1.28 ± 0.09 | 0.49 ± 0.05* | 0.47 ± 0.04* |