
Fig. 1.
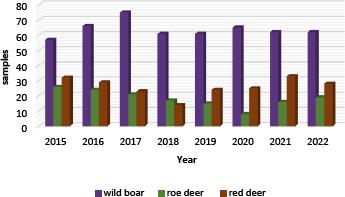
Fig. 2.
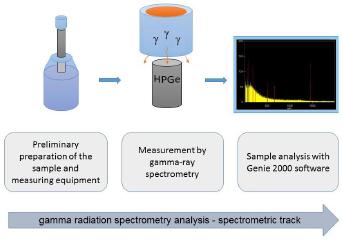
Fig. 3.
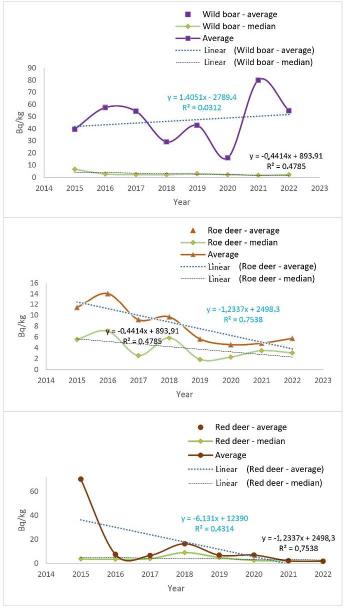
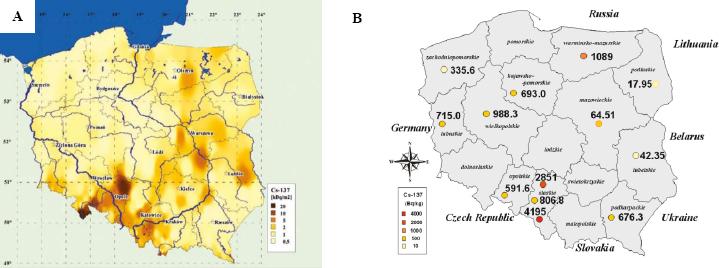
Fig. 4.
Caesium-137 in the muscle tissue of the studied animals
| Parameter | Matrix | ||
|---|---|---|---|
| Boar muscle (Sus scrofa) | Roe deer muscle (Capreolus capreolus) | Red deer muscle (Cervus elaphus) | |
| Number of samples (n) | 508 | 145 | 205 |
| Minimum concentration (Bq/kg) | 0.130 | 0.310 | 0.280 |
| Maximum concentration (Bq/kg) | 4,195 | 111.5 | 86.67 |
| Average concentration (Bq/kg) | 42.84 | 9.909 | 5.265 |
| Standard deviation | 251.4 | 16.11 | 9.952 |
| Median | 2.370 | 3.680 | 2.570 |
| n > MDA | 321 | 96 | 127 |
| n < MDA | 187 | 49 | 78 |
Concentration ratios (CR) in the muscle tissue of the studied animals and effective equivalent doses of caesium-137 from their consumption
| AM (Bq/kg) | CR | |||
|---|---|---|---|---|
| Year | Soil at depth up to 10 cm | Boar muscle (Sus scrofa) | Roe deer muscle (Capreolus capreolus) | Red deer muscle (Cervus elaphus) |
| 2016 | 13.16 | 4.365 | 1.068 | 0.571 |
| 2019 | 12.50 | 3.425 | 0.450 | 0.545 |
| 2020 | 15.20 | 1.059 | 0.301 | 0.456 |
| Effective equivalent dose (μSv) | ||||
| 2015 | – | 0.655 | 0.148 | 0.914 |
| 2016 | – | 0.744 | 0.183 | 0.097 |
| 2017 | – | 0.707 | 0.119 | 0.085 |
| 2018 | – | 0.379 | 0.126 | 0.213 |
| 2019 | – | 0.556 | 0.073 | 0.088 |
| 2020 | – | 0.209 | 0.060 | 0.090 |
| 2021 | – | 1.040 | 0.063 | 0.028 |
| 2022 | – | 0.712 | 0.075 | 0.023 |
Average and ranges of caesium-137 concentrations in wild boar, roe deer and red deer muscle in individual years
| Year | Wild boar muscle | Roe deer muscle | Red deer muscle | ||||||
|---|---|---|---|---|---|---|---|---|---|
| n | Average (Bq/kg) | Range | n | Average (Bq/kg) | Range | n | Average (Bq/kg) | Range | |
| Median (Bq/kg) | Median (Bq/kg) | Median (Bq/kg) | |||||||
| 2015 | 58 | 50.39 | 0.340–591.7 | 26 | 11.41 | 0.590–111.5 | 32 | 70.33 | 0.630–46.71 |
| 2016 | 66 | 57.26 | 0.400–1,089 | 24 | 14.06 | 0.500–110.5 | 29 | 7.519 | 0.570–37.61 |
| 2017 | 75 | 54.44 | 0.500–2,851 | 21 | 9.172 | 0.600–48.60 | 23 | 6.559 | 0.680–53.78 |
| 2018 | 61 | 29.19 | 0.130–693.0 | 17 | 9.671 | 1.150–73 84 | 14 | 16.36 | 0.340–86.67 |
| 2019 | 61 | 42.82 | 0.230–806.8 | 15 | 5.612 | 0.320–49.98 | 24 | 6.788 | 0.280–31.39 |
| 2020 | 65 | 16.09 | 0.320–203.6 | 8 | 4.583 | 0.620–14.40 | 22 | 6.930 | 0.500–38.58 |
| 2021 | 62 | 80.05 | 0.500–4,195 | 16 | 4.847 | 0.310–31.30 | 33 | 2.149 | 0.360–6.798 |
| 2022 | 60 | 54.80 | 0.500–988.3 | 18 | 5.732 | 0.500–31.30 | 28 | 1.774 | 0.490–6.000 |