
Table 1.
Preparation of standard antimicrobial solutions
| Analyte | Concentration (mg/mL) | Solvent |
|---|---|---|
| Sulfadiazine | 2 | Acetonitrile |
| Sulfamerazine | 5 | Methanol |
| Sulfamethazine | 5 | Methanol |
| Sulfamethoxazole | 5 | Methanol |
| Trimethoprim | 2 | Methanol |
| Tylosin | 2 | Methanol |
| Amoxicillin | 2 | Milli-Q water |
Table 2.
Monitored ions (m/z) and retention time of analysed antibacterial substances
| Analyte | Monitored ion (m/z) | Retention time (min) |
|---|---|---|
| Sulfadiazine | 251.0 | 7.2 |
| Sulfamerazine | 265.0 | 9.9 |
| Sulfamethazine | 279.0 | 11.5 |
| Sulfamethoxazole | 254.0 | 15.1 |
| Trimethoprim | 291.0 | 10.4 |
| Tylosin | 916.0 | 15.7 |
| Amoxicillin | 366.0 | 3.5 |
Table 3.
Spiking levels in matrix-matched calibration curves for all analysed antibacterial substances
| Analyte | Concentration level (mg/kg) | ||||
|---|---|---|---|---|---|
| I | II | III | IV | V | |
| Sulfadiazine | 150 | 300 | 450 | 600 | 750 |
| Sulfamerazine | 150 | 300 | 450 | 600 | 750 |
| Sulfamethazine | 150 | 300 | 450 | 600 | 750 |
| Sulfamethoxazole | 150 | 300 | 450 | 600 | 750 |
| Trimethoprim | 45 | 90 | 120 | 160 | 200 |
| Tylosin | 20 | 40 | 80 | 100 | 150 |
| Amoxicillin | 150 | 250 | 400 | 500 | 600 |
Table 4.
Validation spiking levels
| Analyte | Spiking level (mg/kg) | ||
|---|---|---|---|
| I | II | III | |
| Sulfadiazine | 150 | 450 | 750 |
| Sulfamerazine | 150 | 450 | 750 |
| Sulfamethazine | 150 | 450 | 750 |
| Sulfamethoxazole | 150 | 450 | 750 |
| Trimethoprim | 45 | 90 | 200 |
| Tylosin | 20 | 100 | 150 |
| Amoxicillin | 150 | 400 | 600 |
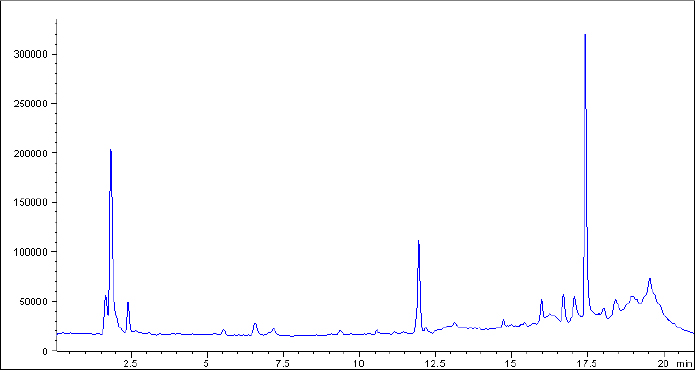
Fig. 1.
Selected-ion monitoring chromatogram of blank feed sample
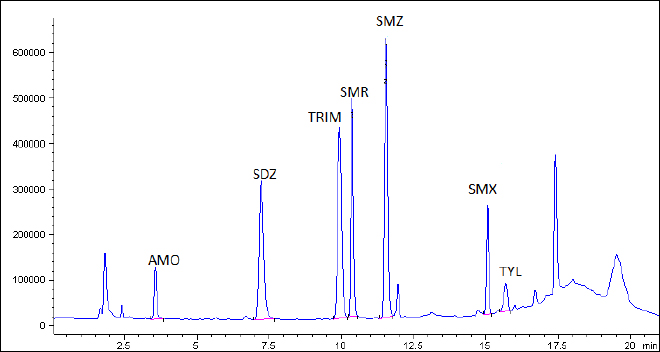
Fig. 2.
Selected-ion monitoring chromatogram of feed matrix spiked with all analysed antibacterial substances at first validation level
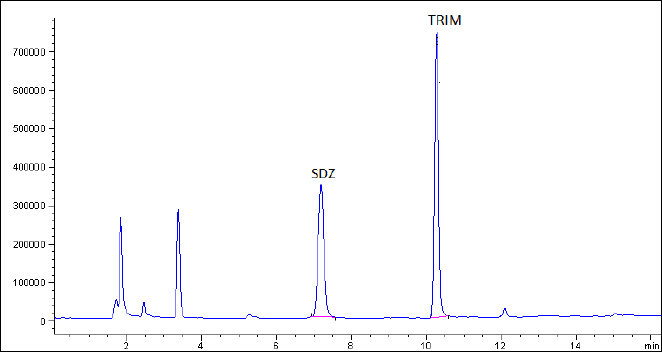
Fig. 3.
Selected-ion monitoring chromatogram of real medicated feed sample for pigs with sulfadiazine and trimethoprim at the concentrations of 450 mg/kg and 90 mg/kg
Table 5a.
Validation report for antibacterial substances
| Analyte | Linearity R2 | LOD (mg/kg) | LOQ (mg/kg) | Recovery (%) | ||
|---|---|---|---|---|---|---|
| I | II | III | ||||
| Sulfadiazine | 1.00 | 48.3 | 69.6 | 96.6 | 104.5 | 99.6 |
| Sulfamerazine | 0.998 | 32.0 | 55.6 | 90.8 | 101.3 | 97.7 |
| Sulfamethazine | 1.00 | 35.3 | 64.0 | 97.2 | 99.3 | 96.6 |
| Sulfamethoxazole | 0.993 | 37.6 | 60.3 | 102.9 | 102.8 | 97.8 |
| Trimethoprim | 1.00 | 17.4 | 28.2 | 94.8 | 98.0 | 95.5 |
| Tylosin | 0.998 | 5.4 | 10.4 | 103.2 | 101.7 | 97.4 |
| Amoxicillin | 0.990 | 91.0 | 119.3 | 101.9 | 100.7 | 96.2 |
Table 5b.
Validation report for antibacterial substances
| Analyte | Repeatability (CV %) | Reproducibility (CV %) | Uncertainty (%) | ||||||
|---|---|---|---|---|---|---|---|---|---|
| I | II | III | I | II | III | I | II | III | |
| Sulfadiazine | 3.2 | 3.6 | 4.8 | 6.5 | 5.7 | 5.6 | 19.0 | 19.0 | 17.0 |
| Sulfamerazine | 3.4 | 3.9 | 6.6 | 5.2 | 4.8 | 6.0 | 24.0 | 14.0 | 18.0 |
| Sulfamethazine | 6.1 | 4.0 | 5.7 | 6.4 | 7.4 | 5.3 | 18.5 | 21.0 | 17.0 |
| Sulfamethoxazole | 5.9 | 4.1 | 5.9 | 7.3 | 5.1 | 6.3 | 21.0 | 16.0 | 18.0 |
| Trimethoprim | 6.9 | 5.6 | 4.1 | 7.1 | 5.4 | 6.4 | 22.0 | 16.0 | 20.0 |
| Tylosin | 3.5 | 5.6 | 6.7 | 6.6 | 5.4 | 7.1 | 20.0 | 16.0 | 20.0 |
| Amoxicillin | 5.6 | 3.3 | 6.0 | 8.3 | 6.1 | 5.8 | 24.0 | 18.0 | 18.0 |
Table 6.
The result for the tested samples of medicated feeds provided by the Veterinary Inspection and feed factories from Poland
| No. | Medicated feed | Active substance content (manufacturer’s declaration) (mg/kg) | Content of active substances determined by the developed method (mg/kg) ± U mg/kg | ||
|---|---|---|---|---|---|
| Sulfadiazine | Trimethoprim | Sulfadiazine | Trimethoprim | ||
| 1 | for piglets | 450 | 90 | 421.6 ± 84.3 | 87.4 ± 20.1 |
| 2 | Porcus Silver | 476.3 ± 95.3 | 100.8 ± 23.2 | ||
| 3 | for pigs | 425.2 ± 85.0 | 86.7 ± 19.9 | ||
| 4 | Porcus Silver | 455.8 ± 91.2 | 96.9 ± 22.3 | ||
| 5 | Pig Lead | 518.6 ± 103.7 | 109.6 ± 25.2 | ||
| 6 | Pig Lead | 453.7 ± 90.7 | 110.5 ± 25.4 | ||
| 7 | for piglets | 411.7 ± 82.3 | 96.2 ± 22.1 | ||
| 8 | Pig Lead | 488.9 ± 97.8 | 100.9 ± 23.2 | ||
| 9 | Porcus Silver | 521.0 ± 104.2 | 101.4 ± 23.3 | ||
| 10 | for pigs | 484.5 ± 96.9 | 91.0 ± 20.9 | ||
| 11 | for pigs | 480.2 ± 96.0 | 122.3 ± 28.1* | ||
| 12 | for piglets | 492.0 ± 98.4 | 92.1 ± 21.2 | ||
| Amoxicillin | |||||
| 13 | for pigs | 400 mg/kg | 381.3 ± 91.5 | ||
| 14 | for pigs | 432.8 ± 103.9 | |||
| Medicated feed samples with sulfadiazine (450 mg/kg) and trimethoprim (90 mg/kg) tested for homogeneity | |||||
| No. | Medicated feed | Sample No. | Sulfadiazine | Trimethoprim | |
| 15 | Porcus Silver | 1 | 505.5 | 101.1 | |
| 2 | 483.2 | 96.6 | |||
| 3 | 554.5 | 110.9 | |||
| 4 | 447.7 | 89.5 | |||
| 5 | 537.4 | 107.5 | |||
| Mean value (mg/kg) | 505.7 ± 101.1 | 116.7 ± 26.8 | |||
| CV (%) | 8.4 | 10.5 | |||
| 16 | Starter for piglets | 1 | 502.8 | 100.6 | |
| 2 | 413.7 | 82.7 | |||
| 3 | 480.5 | 96.1 | |||
| 4 | 448.2 | 89.6 | |||
| 5 | 399.6 | 79.9 | |||
| Mean value (mg/kg) | 448.9 ± 96.0 | 96.0 ± 22.1 | |||
| CV (%) | 9.7 | 9.3 | |||
| 17 | Pig Lead | 1 | 400.3 | 80.1 | |
| 2 | 458.4 | 91.7 | |||
| 3 | 407.6 | 81.5 | |||
| 4 | 405.2 | 81.0 | |||
| 5 | 463.2 | 92.6 | |||
| Mean value (mg/kg) | 426.9 ± 85.4 | 90.7 ± 20.9 | |||
| CV (%) | 7.3 | 6.4 | |||
| 18 | Porcus Silver | 1 | 513.9 | 104.4 | |
| 2 | 583.9 | 116.8 | |||
| 3 | 494.1 | 98.8 | |||
| 4 | 549.4 | 109.9 | |||
| 5 | 512.8 | 102.6 | |||
| Mean value (mg/kg) | 530.8 ± 106.2 | 107.2 ± 24.7 | |||
| CV (%) | 6.7 | 7.2 | |||