
Table 1.
Herpesviruses detected at 0 days post infection (prior to the cyprinid herpesvirus 2 infection)
| Fish species | Sample | PCRs* | Nested PCRs** | Sequence analysis (300 base pairs) | Remarks |
|---|---|---|---|---|---|
| Goldfish | Gill swabs and leukocytes | +/+ | 99% koi herpesvirus | Herpesvirus-positive | |
| Crucian carp | +/+ | 99% koi herpesvirus | |||
| Koi | +/- | 99% goldfish herpesvirus | |||
| Tilapia | All negative | +/- | 98% goldfish herpesvirus | ||
| Grass carp | Gill swabs only*** | +/- | 82% carp pox virus | ||
| 78% koi herpesvirus | |||||
| 78% goldfish herpesvirus | |||||
| 79% sichel herpesvirus |
Table 2.
Herpesvirus detection by different PCRs at 7 days post infection after intraperitoneal injection with goldfish herpesvirus (GHV) isolated from crucian carp
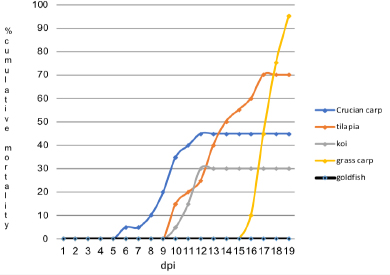
Fig. 1.
Cumulative mortality in five species of fish after intraperitoneal infection with goldfish herpesvirus dpi – days post infection
Table 3.
Investigation of pooled samples from fish that died during the experiment
| Fish species | Detected at 0 dpi | Detected in pooled samples | Overall assessments |
|---|---|---|---|
| Goldfish | KHV | GHV and KHV | Double infection |
| Crucian carp | KHV | GHV and KHV | Double infection |
| Koi | GHV | negative* | Double infection despite negative result |
| Tilapia | GHV | GHV | Double infection |
| Grass carp | new HV | GHV | Triple infection |
Table 4.
Detection of herpesviruses at 20 days post infection after intraperitoneal injection with goldfish herpesvirus (GHV) isolated from crucian carp
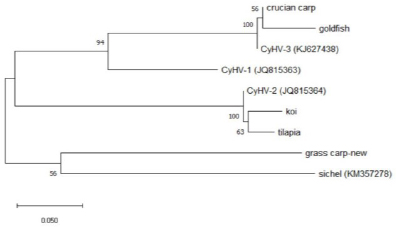
Fig. 2.
Evolutionary analysis by maximum-likelihood method comparing sequences from the NCBI database with the sequences obtained in this study