
Table 1.
Primers1) used in this study for amplification of bovine herpesvirus 6 DNA fragments
| Primer | Genome position2) | Primer sequence (5’→3’) | Use |
|---|---|---|---|
| gBF | 35446-35467 | AACCTTATCCCGTACATGTTTC | PCR |
| gBR | 37722–37691 | CAAAGACCAACATGCCGCCAAA | PCR |
| gHF | 54713–56173 | GAGTCTGGCTTGAATGACGATC | PCR |
| gHR | 56021–54767 | GGGGTCAGTAATGCAGGGCCTA | PCR |
| pL52gBF3) | 35668–35689 | GGTTGGGAATTGCAATCTAACATCACGGTGGACCTTA | nested PCR, cloning |
| pL52gBR | 37056–37036 | GGAGATGGGAAGTCATTAGCTGCTTAAGCGCTTCTCTTC | nested PCR, cloning |
| pL52gHF | 54767–54787 | GGTTGGGAATTGCAATACAAAGTAGACAAAGAAGCT | nested PCR, cloning |
| pL52gHR4) | 56021–55090 | GGAGATGGGAAGTCATTATGATTCTTTGTCTACTTTGTA | nested PCR, cloning |
| LICfor55) | 296–316 | TAATACGACTCACTATAGGG | sequencing, colony PCR |
| LICrev | 559–538 | GAGCGGATAACAATTTCACAGG | sequencing, colony PCR |
1 2) In the genome of the Pennsylvania 47 isolate of bovine herpesvirus 6, GenBank accession number NC_024303;
1 3) Containing a specific sequence (in bold) at the 5’ end enabling annealing to the overhang in a vector;
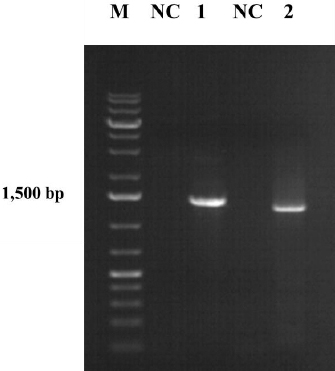
Fig. 1.
Electrophoresis in 1% agarose gel of nested PCR amplification products of bovine herpesvirus 6 glycoprotein-coding genes. M – DNA size marker GeneRuler 1 kb Plus DNA ladder (Thermo Scientific, Vilnius, Lithuania); NC – negative control; 1 – 1,389 bp fragment of gB gene; 2 – 1,254 bp fragment of gH gene
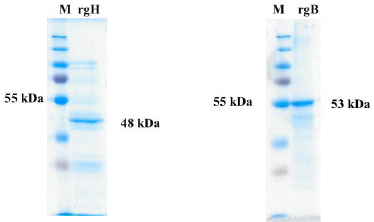
Fig. 2.
Electrophoresis of purified recombinant gH (48 kDa) and gB (53 kDa) proteins of bovine herpesvirus 6 in 10% sodium dodecyl sulphate polyacrylamide gel electrophoresis in denaturing conditions. M – PageRuler Prestained Protein Ladder molecular weight marker (Thermo Scientific, Vilnius, Lithuania)
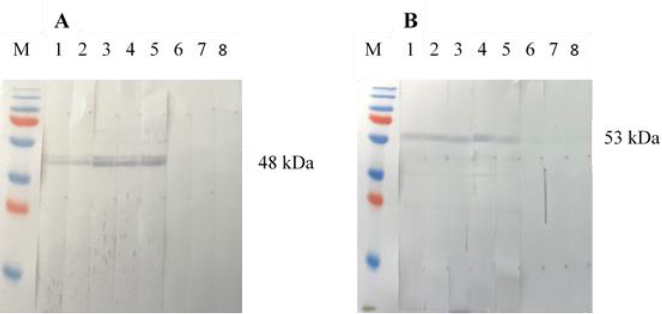
Fig. 3.
Western blot detection of recombinant gH (A) and recombinant gB (B) proteins of bovine herpesvirus 6 with bovine serum samples. Lines 1–4 – field positive sera; line 5 – positive control serum; line 6 – negative control serum; lines 7–8 – field negative sera; M – PageRuler Prestained Protein Ladder molecular weight marker (Thermo Scientific, Vilnius, Lithuania)
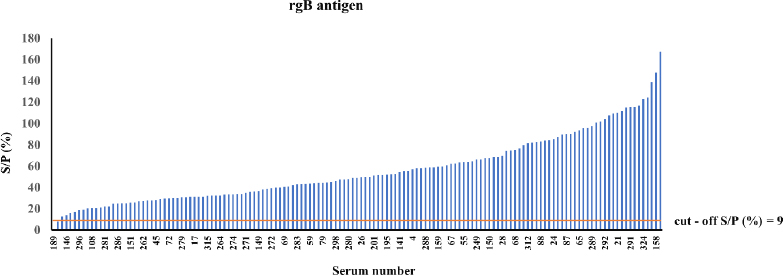
Fig. 4.
Distribution of sample-to-positive ratio (S/P) values among bovine sera tested for bovine herpesvirus 6 with recombinant glycoprotein B (rgB) antigen
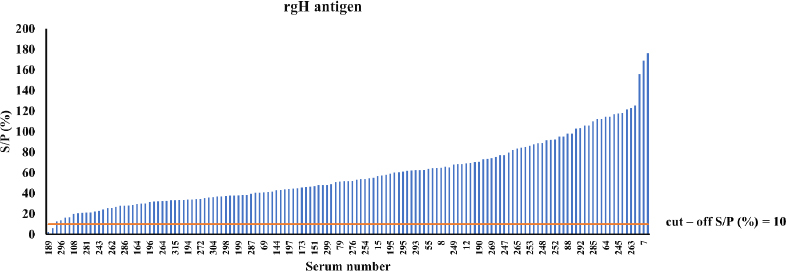
Fig. 5.
Distribution of sample-to-positive ratio (S/P) values among bovine sera tested for bovine herpesvirus 6 with recombinant glycoprotein H (rgH) antigen
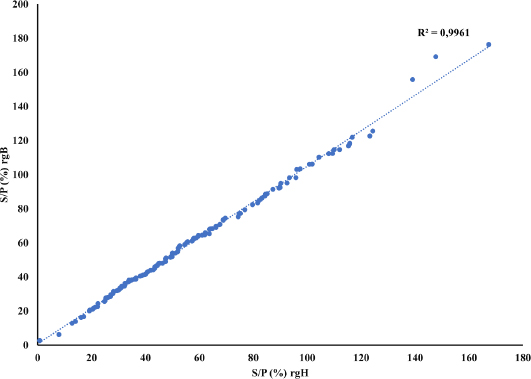
Fig. 6.
Scatter plot analysis of ELISA results showing relationship between bovine herpesvirus 6 recombinant gB and recombinant gH (rgB and rgH) antigens. S/P – sample-to-positive ratio