
Fig. 1.
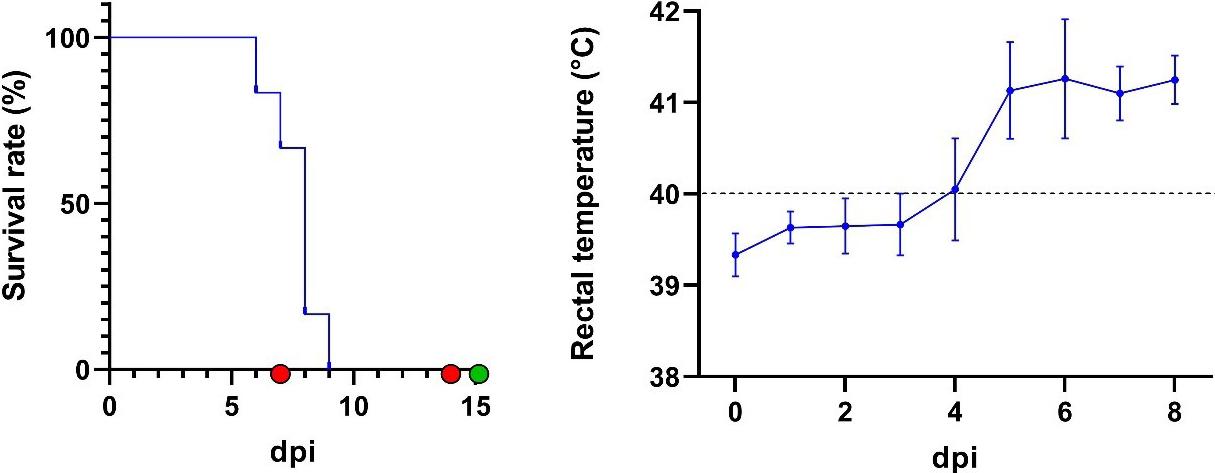
Fig. 2.
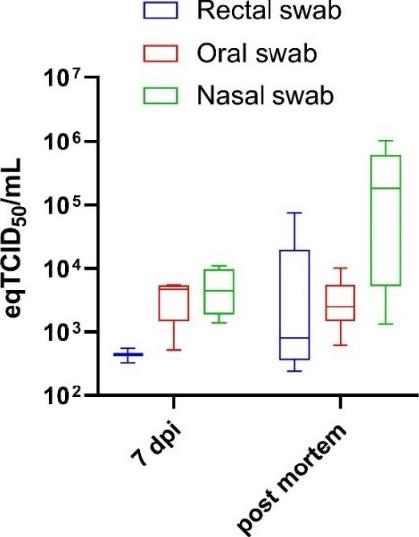
Fig. 3.
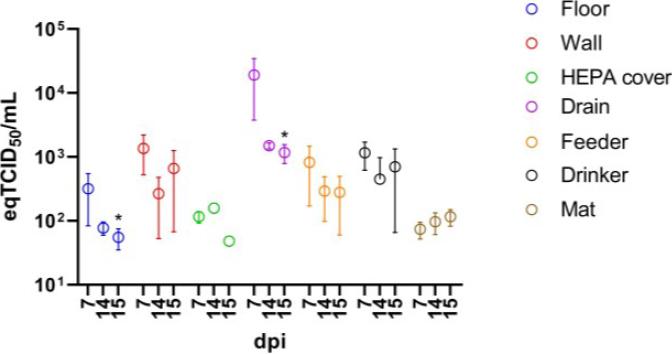
Numbers of positive qPCR-samples in tested animal facility locations and their mean threshold cycle (Ct) values
| Time | Number of positive samples (Mean Ct (±SD)) | |||||||
|---|---|---|---|---|---|---|---|---|
| Floor | Wall | Door | HEPA filter cover | Drain | Feeder | Drinker | Mat | |
| T1 | 14/15 | 3/3 | 0/3 | 2/3 | 2/3 | 3/3 | 3/3 | 2/3 |
| T2 | 4/15 | 2/3 | 0/3 | 1/3 | 1/3 | 3/3 | 3/3 | 3/3 |
| T3 | 5/15 | 2/3 | 0/3 | 1/3 | 1/3 | 3/3 | 3/3 | 3/3 |