
Fig. 1.
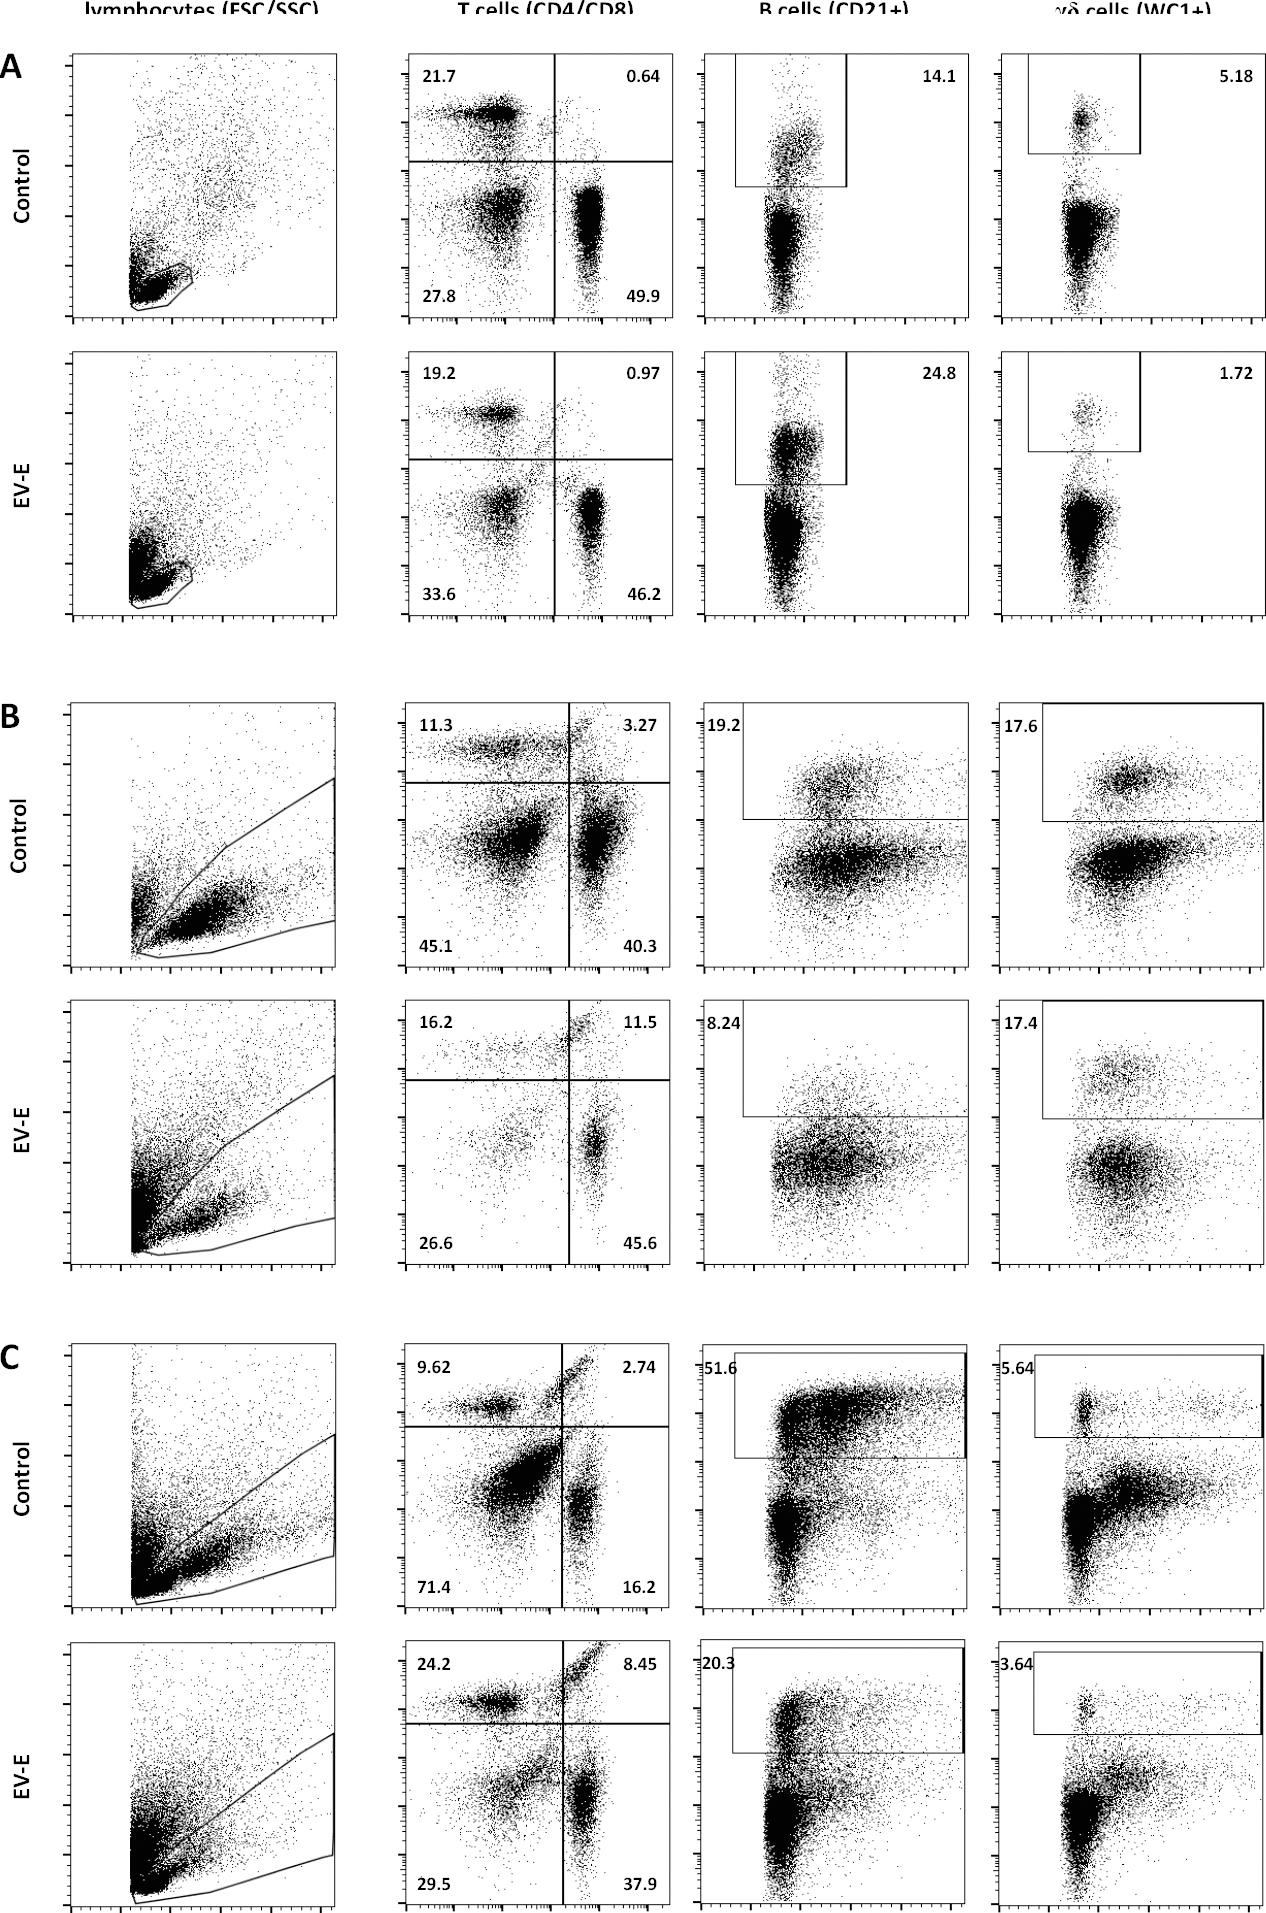
Immunophenotyping of bovine peripheral blood lymphocytes cultured for 72 h in the presence of enterovirus E, n = 5
| Population | Unstimulated | LPS-stimulated | ConA-stimulated | |||||||||
|---|---|---|---|---|---|---|---|---|---|---|---|---|
| C | EV-E (MOI) | C | EV-E (MOI) | C | EV-E (MOI) | |||||||
| 10 | 1 | 0.1 | 10 | 1 | 0.1 | 10 | 1 | 0.1 | ||||
| CD4+CD8− | 44.80 | 44.86 | 42.98 | 42.46 | 19.38 | 34.55** | 31.02* | 38.30*** | 45.98 | 47.48 | 45.30 | 42.24 |
| CD4-CD8+ | 22.20 | 20.28 | 21.58 | 22.10 | 12.72 | 23.30* | 22.22* | 24.05* | 13.36 | 19.54 | 13.21 | 14.45 |
| CD4+CD8+ | 0.97 | 1.92 | 1.17 | 1.04 | 2.89 | 6.09 | 5.83 | 6.90 | 2.39 | 7.34** | 2.93 | 2.31 |
| CD21+ | 15.38 | 21.96 | 20.30 | 19.59 | 47.86 | 16.39*** | 19.71*** | 11.53*** | 18.55 | 9.49 | 18.46 | 17.66 |
| WC1+ | 4.31 | 1.80 | 5.29 | 5.81 | 4.28 | 2.28 | 3.45 | 3.32 | 16.98 | 18.86 | 14.53 | 13.55 |
Serum anti-EV-E antibody titres, intracellular viral RNA levels and extracellular virus titres from bovine PBMCs
| Parameter | Individual | |||||||||
|---|---|---|---|---|---|---|---|---|---|---|
| 1 | 2 | 3 | 4 | 5 | 6 | 7 | 8 | 9 | 10 | |
| anti-EV-E antibody titer in serum | ND | 1:40 | 1:20 | 1:80 | 1:20 | 1:40 | 1:80 | 1:40 | 1:20 | 1:160 |
| extracellular virus titer (log CCID50/1 mL) | 3.625 | 1.75 | 3.25 | 3.125 | 3.875 | 3.125 | 2.125 | 3.625 | 2.75 | 3.125 |
| intracellular viral RNA (copy number/μL of RNA) | 13.39 | 37.48 | 1.866 | 4913 | 7.133 | 14.82 | 3.852 | 54740 | 20.1 | 9.610 |
Enterovirus E effect on the viability and blastogenic response of bovine peripheral blood mononuclear cells to mitogens shown by the MTT reduction assay, n=10
| Parameter | C | EV-E (MOI) | ||
|---|---|---|---|---|
| 10 | 1 | 0.1 | ||
| viability (%) | 100 | 58.928** | 80.927 | 104.685 |
| proliferation ConA (SI) | 4.332 | 2.198*** | 4.712 | 3.960 |
| proliferation LPS (SI) high responders | 2.085 | 1.479*** | 1.212*** | 1.095*** |
| proliferation LPS (SI) low responders | 0.924 | 1.084 | 0.925 | 0.880 |
Cytokine levels in supernatants from bovine peripheral blood mononuclear cells cultured for 72 h in the presence of enterovirus E, n = 5
| Cytokine (pg/mL) | Unstimulated | LPS-stimulated | ||||||
|---|---|---|---|---|---|---|---|---|
| C | EV-E (MOI) | C | EV-E (MOI) | |||||
| 10 | 1 | 0.1 | 10 | 1 | 0.1 | |||
| IL-1β | 3.56 | 62.09*** | 96.55*** | 24.67* | 21.81 | 5.35** | 24.36 | 17.53 |
| IL-6 | 89.32 | 141.89 | 784.94*** | 864.22*** | 1292.09 | 1209.51 | 1151.45 | 1152.22 |
| TNF-α | 129.09 | 207.14 | 1057.82*** | 1236.32*** | 1780.26 | 2037.78 | 1684.56 | 1682.79 |
Monoclonal antibodies used in the study
| Marker | Expressed by | Fluorochrome | Clone | Isotype |
|---|---|---|---|---|
| CD4 | subset of T cells | FITC | CC8 | IgG2a |
| CD8 | subset of T cells | Alexa Fluor 647 | CC63 | IgG2a |
| WC1 | gamma/delta (γδ) T cells | FITC | CC15 | IgG2a |
| CD21 | B cells | RPE | CC51 | IgG2b |
Primer sequences used for the detection of intracellular enterovirus E RNA
| Primer | Primer sequence (5′–3′) | Amplicon size | GenBank accession No. |
|---|---|---|---|
| EV-E802 forward | AAAGGGGGCTGTCGAAACCA | 802 | DQ092769.1 |
| EV-E 802 reverse | GCTAGTGGGCTCAGACTCCG | ||
| EV-E 183 forward | TACGCCTTTCGTGGCTTGGA | 183 | |
| EV-E 183 reverse | TTGCTTTTCCTGGCTTGCCG |
Oxidative burst activity of bovine peripheral blood phagocytes after 3 h incubation with enterovirus E, n = 5
| Cell type | Parameter | C | EV-E (MOI) | ||
|---|---|---|---|---|---|
| 10 | 1 | 0.1 | |||
| granulocytes | % | 91.62 ± 4.3 | 92.18 ± 3.98 | 92.94 ± 3.86 | 92.76 ± 4.23 |
| MFI | 1797.6 ± 269.67 | 1774.6 ± 291.22 | 1831.4 ± 280.50 | 1793.8 ± 286.99 | |
| monocytes | % | 43.32 ± 7.70 | 32.62 ± 3.74 | 35.90 ± 6.94 | 37.46 ± 6.65 |
| MFI | 299.2 ± 87.04 | 208.4 ± 71.53 | 240.2 ± 74.89 | 247.2 ± 93.38 | |