
Fig. 1.
Fig. 2.
Fig. 3.
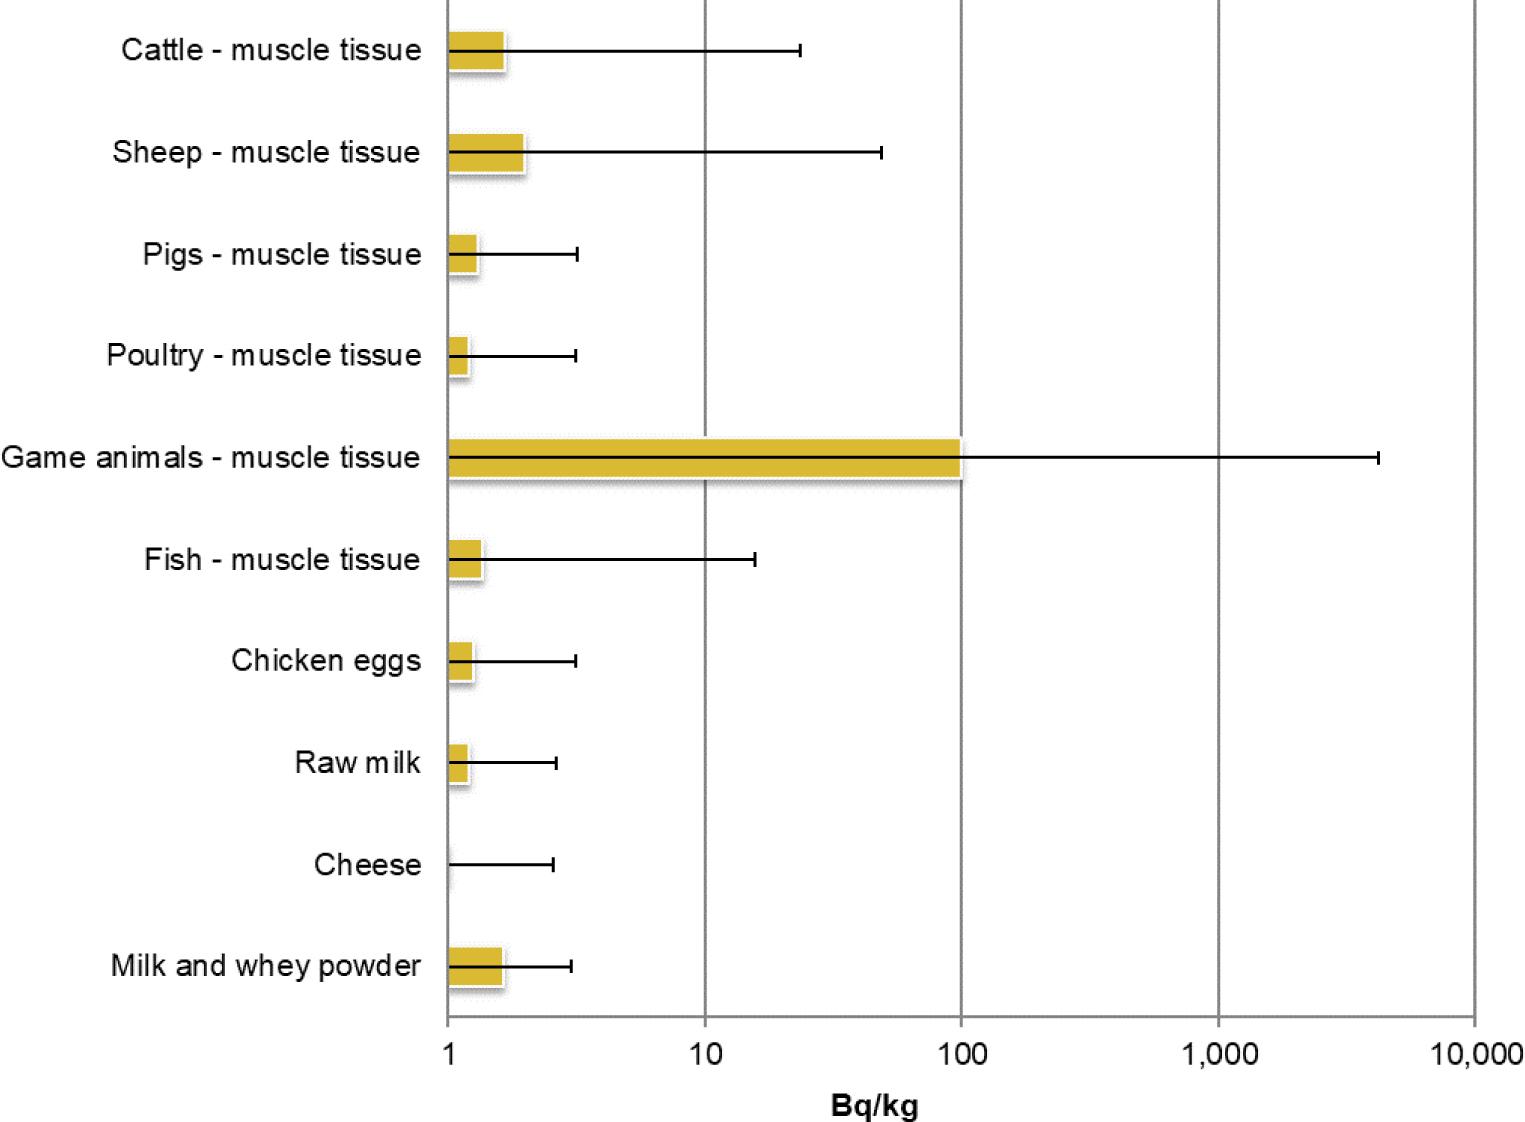
Effective equivalent dose determined for each matrix
| Matrix | Average concentration of | HE per kg of product (μSv) |
|---|---|---|
| Cattle – muscle tissue | 1.66 | 0.02 |
| Sheep – muscle tissue | 1.98 | 0.03 |
| Pig – muscle tissue | 1.31 | 0.02 |
| Poultry – muscle tissue | 1.21 | 0.02 |
| Game animals – muscle tissue | 99.7 | 0.83 |
| Fish – muscle tissue | 1.36 | 0.02 |
| Chicken eggs | 1.25 | 0.02 |
| Raw milk | 1.21 | 0.02 |
| Cheese | 0.42 | 0.01 |
| Milk and whey powder | 1.65 | 0.02 |
Number of samples and % of results below and above MDC values for each matrix
| Matrix | <MDC | >MDC | ||
|---|---|---|---|---|
| n | % | n | % | |
| Cattle – muscle tissue | 177 | 86 | 28 | 14 |
| Sheep – muscle tissue | 59 | 75 | 20 | 25 |
| Pigs – muscle tissue | 182 | 99 | 1 | 1 |
| Poultry – muscle tissue | 212 | 100 | - | - |
| Game animals – muscle tissue | 47 | 41 | 67 | 59 |
| Fish – muscle tissue | 191 | 93 | 4 | 7 |
| Chicken eggs | 193 | 100 | - | - |
| Raw milk | 200 | 98 | 3 | 2 |
| Cheese | 25 | 96 | 1 | 4 |
| Milk and whey powder | 1 | 17 | 5 | 83 |
Summary of samples
| Official monitoring tests in 2021 | Commercial sample tests 2017–2021 | Total | |
|---|---|---|---|
| Matrix | Number of samples | ||
| Cattle – muscle tissue | 202 | 3 | 205 |
| Sheep – muscle tissue | 79 | - | 79 |
| Pigs – muscle tissue | 180 | 3 | 183 |
| Poultry – muscle tissue | 192 | 20 | 212 |
| Game animals – muscle tissue | 110 | 4 | 114 |
| Fish – muscle tissue | 192 | 3 | 195 |
| Chicken eggs | 193 | - | 193 |
| Raw milk | 188 | 15 | 203 |
| Cheese | - | 26 | 26 |
| Milk and whey powder | - | 6 | 6 |
| Total | 1,336 | 80 | 1,416 |