
Fig. 1.
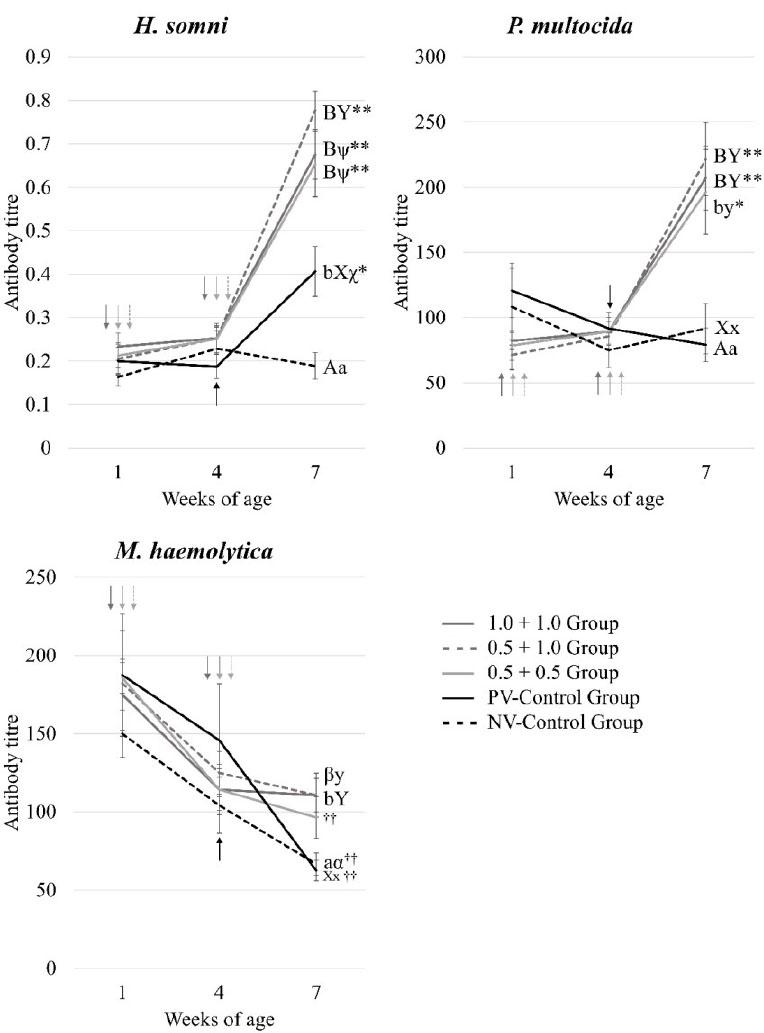
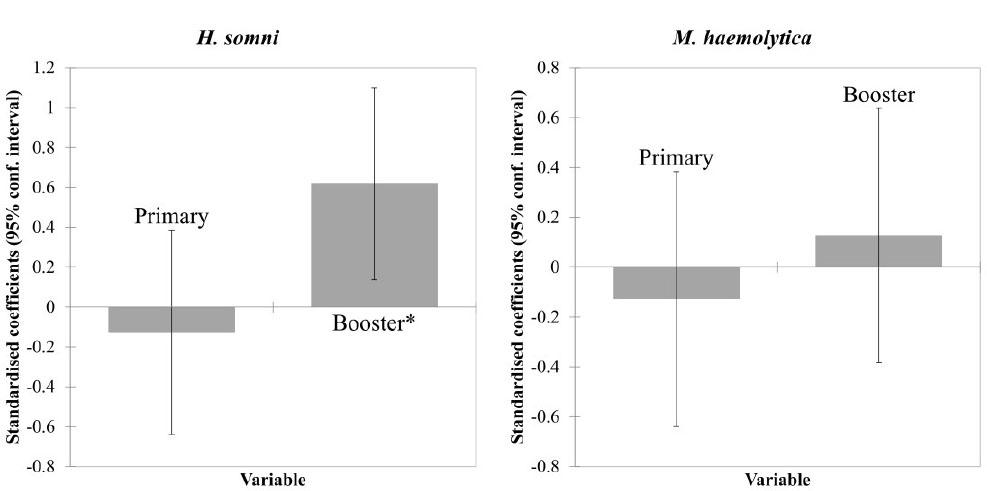
Fig. 2.
Body mass index (BMI) values for the experimental and control groups of young Holstein calves and null hypothesis validity of the values
| Group | BMI | P-value | ||||
|---|---|---|---|---|---|---|
| 1.0 + 1.0 | 0.5 + 1.0 | 0.5 + 0.5 | PV-Control | NV-Control | ||
| 1.0 + 1.0 | 64.9 ± 0.8 | 1 | 0.898 | 1.000 | 0.731 | 0.715 |
| 0.5 + 1.0 | 64.0 ± 0.9 | 0.898 | 1 | 0.975 | 0.568 | 0.534 |
| 0.5 + 0.5 | 64.6 ± 0.8 | 1.000 | 0.975 | 1 | 0.731 | 0.584 |
| PV-Control | 66.8 ± 1.5 | 0.731 | 0.568 | 0.731 | 1 | 0.999 |
| NV-Control | 66.8 ± 1.7 | 0.715 | 0.534 | 0.584 | 0.999 | 1 |
The number of calves with high and low maternal antibody levels and with positive and negative vaccine responses to (a) H_ somni, (b) P_ multocida and (c) M_ haemolytica
| (a) | One week of age | Seven weeks of age | ||||
|---|---|---|---|---|---|---|
| H. somni | High MAL | Low MAL | P-value | Positive | Negative | P-value |
| 1.0 + 1.0 | 0 | 14 | − | 11 | 3 | 0.005** |
| 0.5 + 1.0 | 0 | 14 | − | 12 | 2 | 0.000** |
| 0.5 + 0.5 | 0 | 14 | − | 5 | 9 | 0.556 |
| PV-Control | 0 | 12 | − | 1 | 11 | 0.008** |
| NV-Control | 0 | 12 | − | 0 | 12 | 0.000** |
| P-value | 1.000 | 0.000** | ||||
| (b) | One week of age | Seven weeks of age | ||||
| P. multocida | High MAL | Low MAL | P-value | Positive | Negative | P-value |
| 1.0 + 1.0 | 9 | 5 | − | 14 | 0 | 0.015* |
| 0.5 + 1.0 | 4 | 10 | − | 14 | 0 | 0.015* |
| 0.5 + 0.5 | 6 | 8 | − | 13 | 1 | 0.159 |
| PV-Control | 7 | 5 | − | 5 | 7 | 0.006** |
| NV-Control | 6 | 6 | − | 4 | 8 | 0.000** |
| P-value | 0.402 | 0.000** | ||||
| (c) | One week of age | Seven weeks of age | ||||
| M. haemolytica | High MAL | Low MAL | P-value | Positive | Negative | P-value |
| 1.0 + 1.0 | 9 | 5 | − | 2 | 12 | − |
| 0.5 + 1.0 | 6 | 8 | − | 3 | 11 | − |
| 0.5 + 0.5 | 12 | 2 | − | 2 | 12 | − |
| PV-Control | 5 | 7 | − | 0 | 12 | − |
| NV-Control | 6 | 6 | − | 0 | 12 | − |
| P-value | 0.104 | 0.275 | ||||
Dosages of the vaccine and sample size
| Group | Dose at one week of age | Dose at four weeks of age | Sample size |
|---|---|---|---|
| 1.0 + 1.0 | 1.0 mL | 1.0 mL | n = 14 |
| 0.5 + 1.0 | 0.5 mL | 1.0 mL | n = 14 |
| 0.5 + 0.5 | 0.5 mL | 0.5 mL | n = 14 |
| PV-Control | Not vaccinated | 1.0 mL | n = 12 |
| NV-Control | Not vaccinated | Not vaccinated | n = 12 |