
Table 1.
Resistance rates of 102 methicillin-resistant (MRSA) strains of different avian origins to 18 antimicrobials
| Drug Class | Antibacterial drugs | MRSA (n = 102) | P-value | Overall drug resistance rate | ||
|---|---|---|---|---|---|---|
| Layers | Broilers | Waterfowl | ||||
| Penicillin | PEN | 100% | 100% | 100% | ns | 100% |
| OXA | 97.10% | 97.80% | 95.50% | 0.87 (ns) | 97.06% | |
| Quinolones | ENR | 100% | 100% | 100% | ns | 100% |
| OFL | 100% | 100% | 100% | ns | 100% | |
| Cephalosporins | CFX | 97.10% | 97.80% | 95.50% | 0.87 (ns) | 97.06% |
| FOX | 100% | 97.80% | 100% | 0.53 (ns) | 99.02% | |
| Sulfonamides | SF | 28.60% | 4.40% | 13.60% | 0.01** | 14.71% |
| SXT | 20.00% | 24.40% | 13.60% | 0.59 (ns) | 19.33% | |
| Macrolides | ERY | 100% | 100% | 100% | ns | 100% |
| TIL | 100% | 100% | 100% | ns | 100% | |
| β-lactamase inhibitor class | A/C | 77.10% | 95.60% | 68.20% | 0.009** | 77.45% |
| Lincosamides | CLI | 100% | 100% | 100% | ns | 100% |
| Glycopeptides | VAN | 0.00% | 0.00% | 0.00% | ns | 0.00% |
| Tetracycline | DOX | 2.80% | 11.11% | 0% | 0.18 (ns) | 4.63% |
| Amide alcohols | FFC | 100% | 100% | 100% | ns | 100% |
| Pleuromutilin | TIA | 100% | 100% | 77.30% | <0.001*** | 95.10% |
| Aminoglycosides | GEN | 100% | 100% | 90.90% | 0.04* | 98.04% |
| Azolidinones | LZD | 2.80% | 2.20% | 0.00% | 0.74 (ns) | 1.96% |
1 PEN – penicillin; OXA – benzocillin; ENR – enrofloxacin; OFL – ofloxacin; CFX – cephalexin; FOX – cefoxitin; SF – sulfisoxazole; SXT – cotrimoxazole; ERY – erythromycin; TIL – temsirolimus; A/C – amoxicillin/clavulanic acid; CLI – clindamycin; VAN – vancomycin; DOX – doxorubicin; FFC – florfenicol; TIA – tiamulin; GEN – gentamicin; LZD – linezolid; ns – non-significant (P > 0.05);
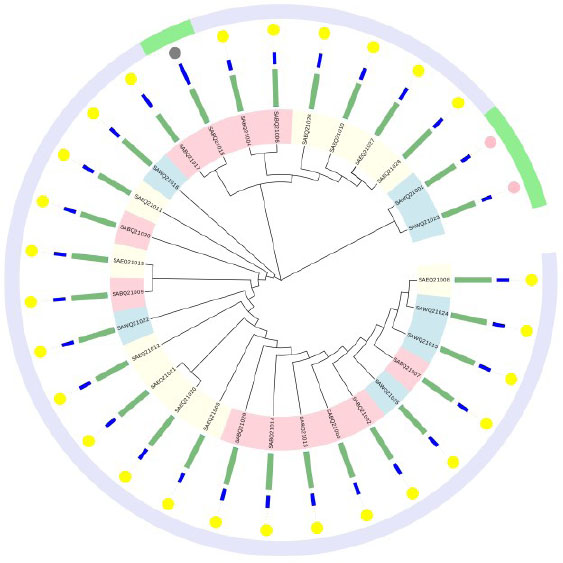
Fig. 1.
Evolutionary tree of the core genome of methicillin-resistant Staphylococcus aureus (n = 30) from different avian sources. From the outside to the inside, the order is ST type (light purple is ST9, green is ST398), spa type (yellow is t899, pink is t034 and dark grey is t1250), number of drug resistance genes, number of virulence genes, quantity, and source (red is from broilers, yellow is from layers and blue is from waterfowl)
Table 2.
Multi-locus sequence, staphylococcal protein A and staphylococcal cassette chromosome mec (SCCmec) typing results of 102 different avian-derived methicillin-resistant Staphylococcus aureus strains (number of strains/percentage %)
| Type | ST9-t899 (n = 97) | ST9-t1939 (n = 2) | ST398-t034 (n = 2) | ST398-t1250 (n = 1) | |||
|---|---|---|---|---|---|---|---|
| SCCmec III | SCCmec IVb | Not typed | SCCmec IVb | SCCmec III | SCCmec V | SCCmec III | |
| Layers | 10 (9.80) | 22 (21.57) | 2 (0.98) | 0 | 0 | 0 | 0 |
| Broilers | 5 (4.90) | 37 (36.27) | 0 | 2 (1.96) | 0 | 0 | 1 (0.98) |
| Waterfowl | 3 (2.94) | 13 (12.75) | 5 (4.90) | 0 | 1 (0.98) | 1 (0.98) | 0 |
| Total | 17.65% | 70.59% | 6.86% | 1.96% | 0.98% | 0.98% | 0.98% |
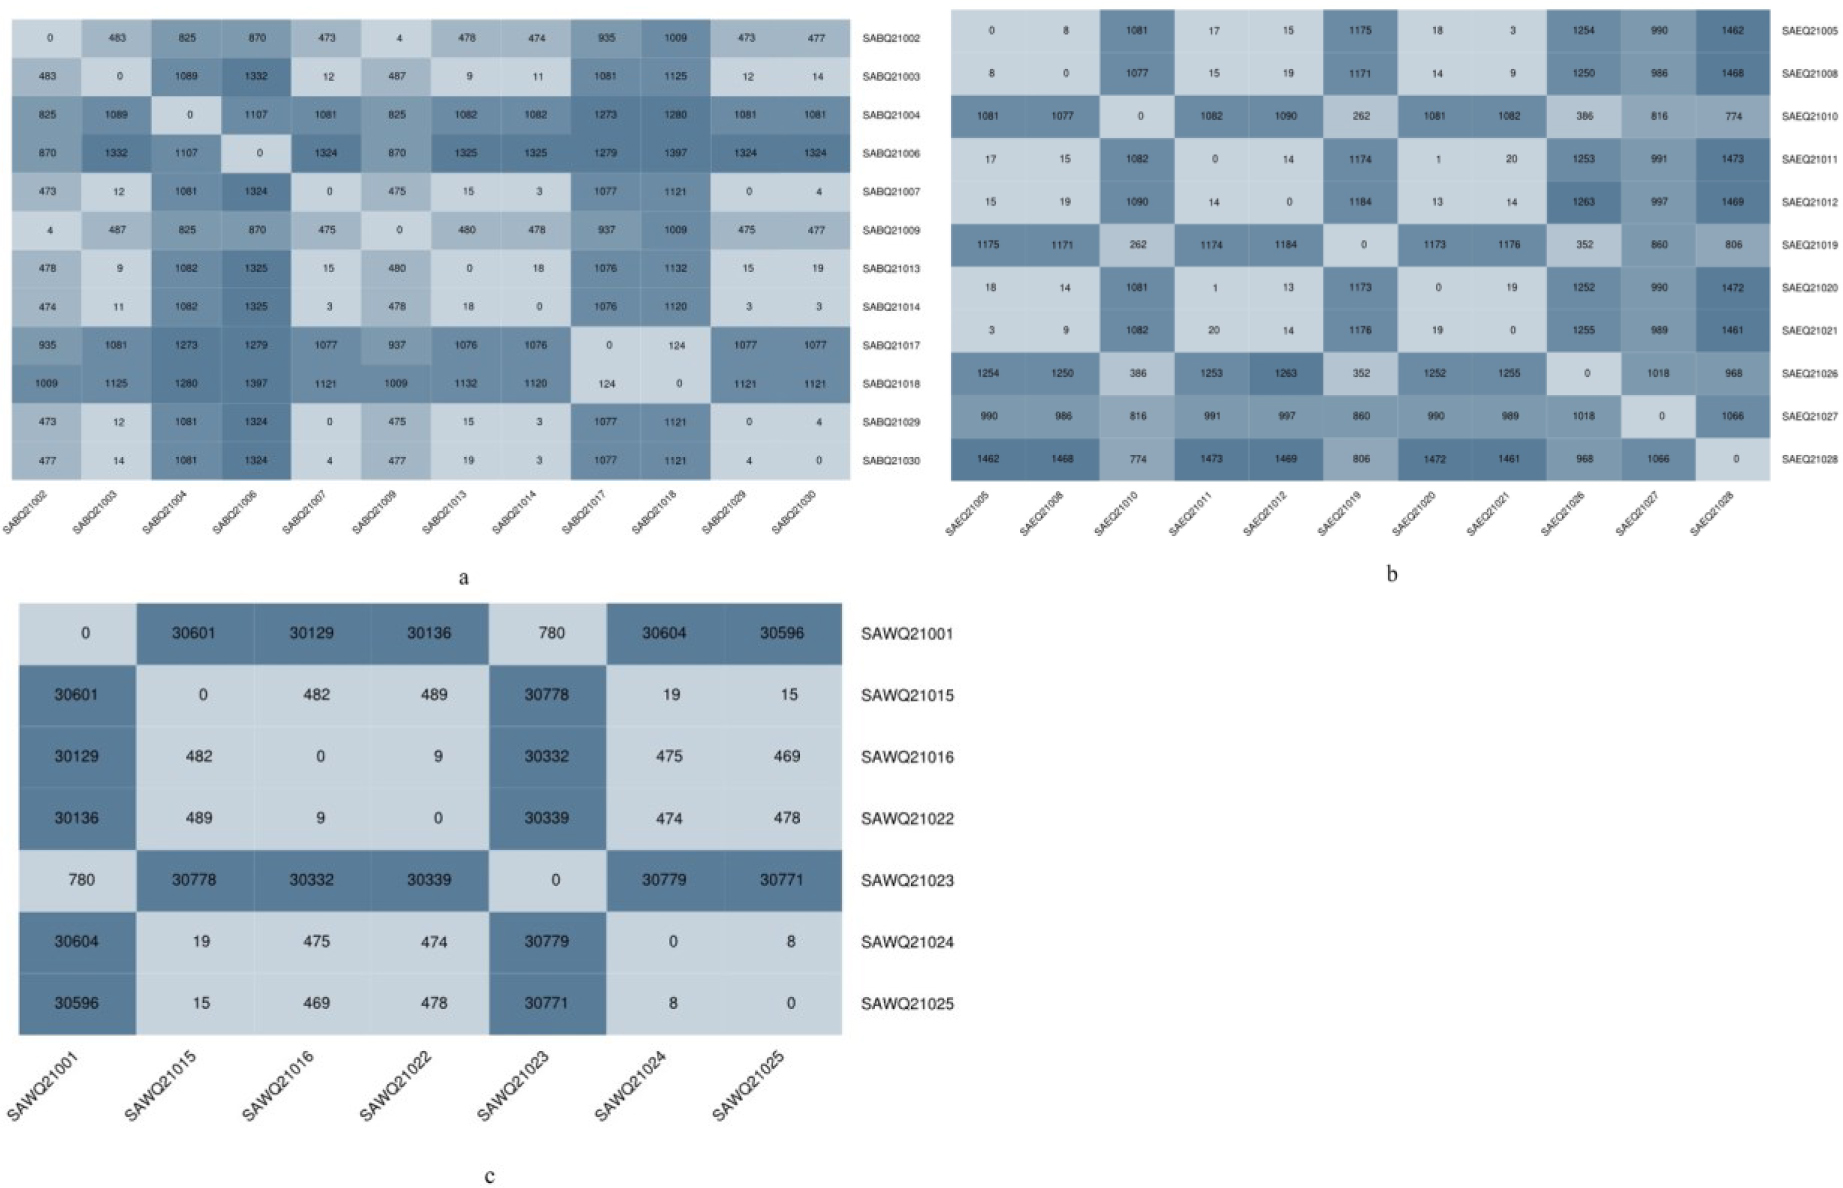
Fig. 2.
Genome-wide single nucleotide polymorphism locus difference analysis of methicillin-resistant Staphylococcus aureus from: a – broiler sources; b – egg sources; c – waterfowl sources. Darker colour indicates more differential loci. SABQ – Staphylococcus aureus isolated from broilers; SAEQ – Staphylococcus aureus isolated from egg-layers; SAWQ – Staphylococcus aureus isolated from waterfowl
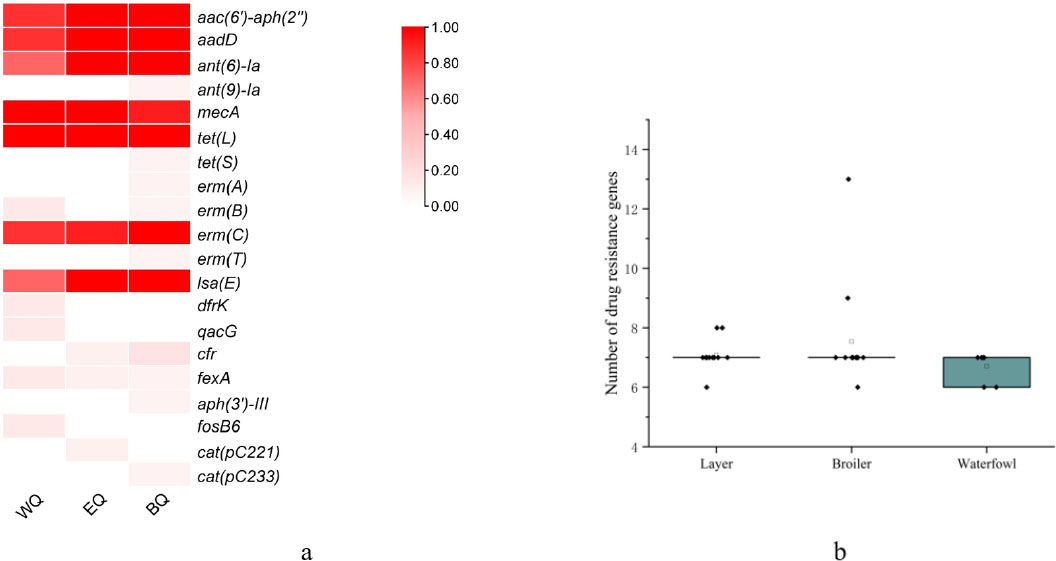
Fig. 3.
Carriage rate (a) and number (b) of drug resistance genes in 30 strains of methicillin-resistant Staphylococcus aureus of different avian sources. EQ – layer source; WQ – waterfowl source; BQ – broiler source. Intensity of red in the left part of the figure represents carriage and 0.00–1.00 equates to 0–100% carriage
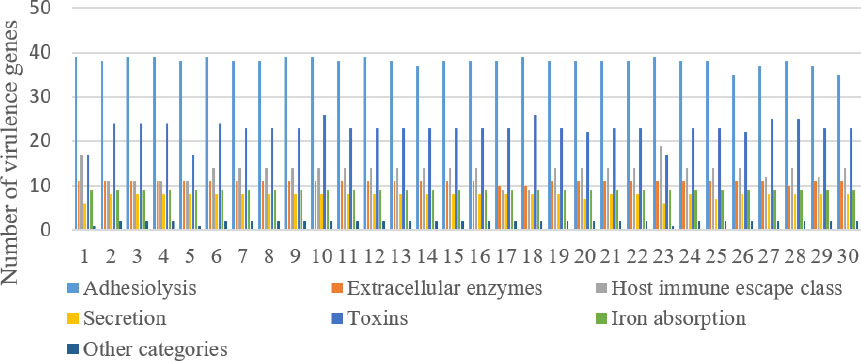
Fig. 4.
Types and numbers of methicillin-resistant Staphylococcus aureus virulence genes of different avian origins
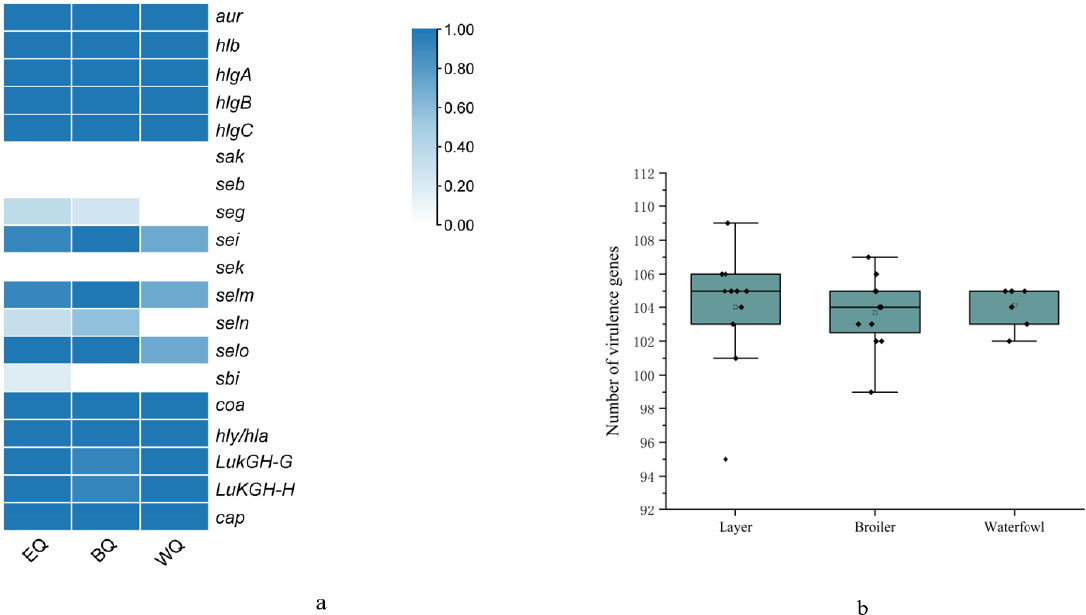
Fig. 5.
Carriage rate (a) and number (b) of partial virulence genes in 30 strains of methicillin-resistant Staphylococcus aureus from different avian sources. EQ –layer source; WQ – waterfowl source; BQ – broiler source. Intensity of blue in the left part of the figure represents carriage and 0.00–1.00 equates to 0–100% carriage
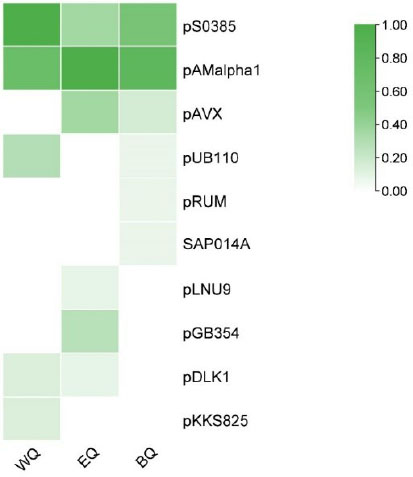
Fig. 6.
Plasmid carriage of 30 methicillin-resistant Staphylococcus aureus strains from different poultry sources. EQ – layer source; WQ – waterfowl source and BQ – broiler source. Intensity of green represents carriage and 0.00–1.00 equates to 0–100% carriage