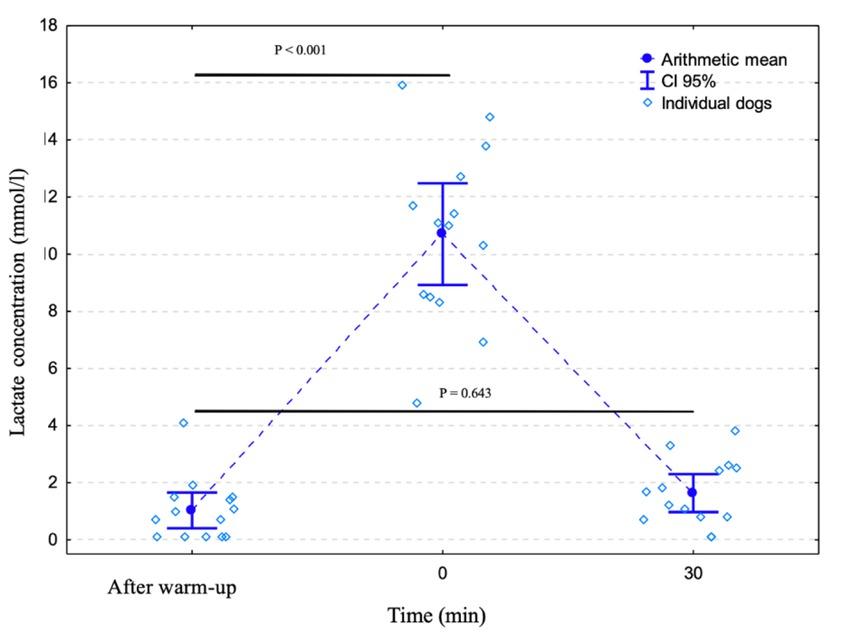
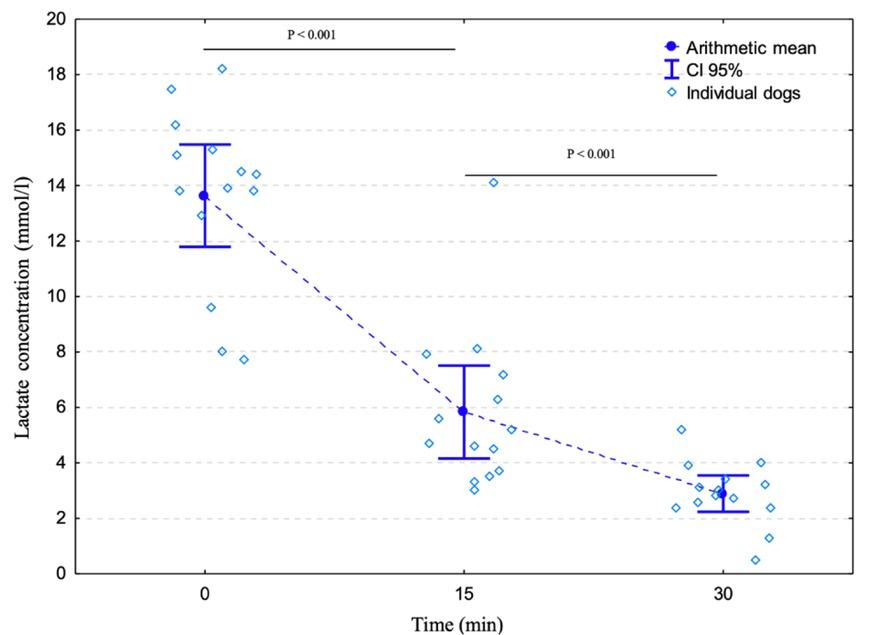
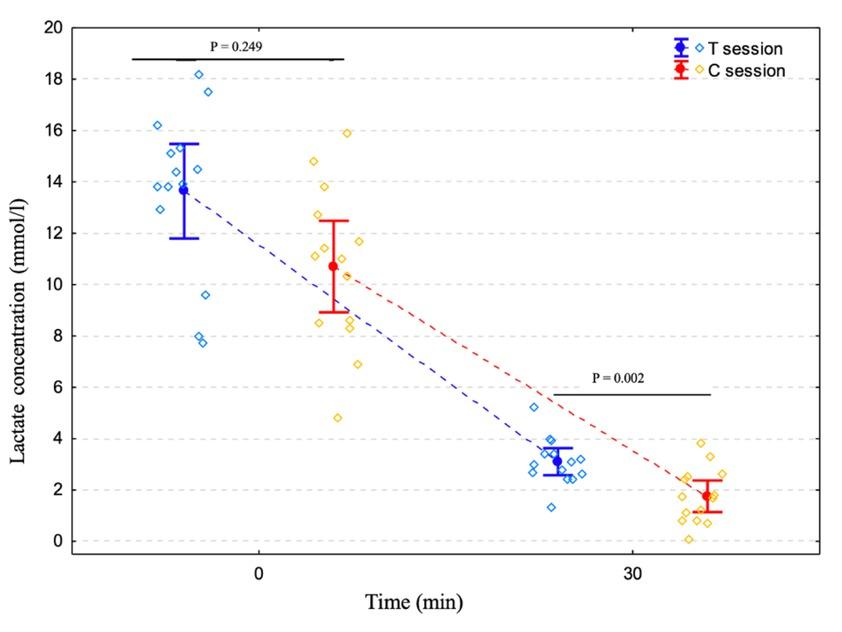
Have a personal or library account? Click to login
Exercise-induced haematological and blood lactate changes in whippets training for lure coursing Cover

Exercise-induced haematological and blood lactate changes in whippets training for lure coursing

Open Access
|Mar 2023

Figures & Tables

Fig. 2

Change in lactate concentration (mmol/L) after the exercise (C) session measured after the warm up, immediately after, and 30 min after the exertion

Fig. 3

Change in lactate concentration (mmol/L) after two types of exertion (a training (T) session and a coursing (C) session) presented as the arithmetic mean (dot), 95% confidence interval (whiskers) and measurements of individual dogs (diamonds)

Fig. 1

Change in lactate concentration (mmol/L) after the training (T) session measured immediately after (0), 15 min after and 30 min after the exertion

Change in haematological measurements after two types of session – training (T) and coursing (C)

Blood parameterReference intervalBaselineAfter T sessionBaseline vs T P-valueaAfter C sessionBaseline vs C valuea P-T vs C P-value
WBC (g/L)6.0–16.55.4 ± 0.9 (4.1–7.4)7.8 ± 2.1 (5.1–11.4)0.002*7.27 ± 0.94 (5.8–8.6)<0.001*0.999
RBC (T/L)5.5–8.57.5 ± 0.9 (4.8–8.3)8.5 ± 0.5 (7.6–9.7)0.001*8.18 ± 0.51 (7.2–9.0)0.039*0.149
HGB (mmol/L)7.5–11.311.5 ± 1.4 (7.4–13.0)12.9 ± 0.7 (11.9–14.6)0.010*13.1 ± 0.8 (12.1–14.4)0.007*0.482
HCT (L/L)0.37–0.550.54 ± 0.06 (0.35–0.61)0.62 ± 0.03 (0.57–0.70)0.001*0.6 ± 0.03 (0.6–0.7)0.009*0.696
PLT (g/L)200–580216.4 ± 26.2 (174–281)243.9 ± 32.8 (193–294)0.028*211.4 ± 16.2 (188–242)0.9990.002*

Changes in mean lactate concentrations (mmol/L) after two types of session – training (T) and coursing (C)

Lactate concentration (mmol/L)
Mean difference ± SDImmediately after
Type of effortImmediately after session30 min after session(CI 95%)vs 30 min after, P-value
T session13.6 ± 3.2 (7.7–18.2)3.1 ± 0.9 (1.3–5.2)10.5 ± 2.7 (8.5, 12.6)<0.001
C session10.7 ± 3.1 (4.8–15.0)1.8 ± 1.1 (0.1–3.8)8.9 ± 3.3 (6.4, 11.5)<0.001
Mean difference ± SD (CI 95%)2.9 ± 5.4 (−1.2, 7.1)1.4 ± 1.1 (0.5, 2.2)
T vs C, P-value0.20.002*
Language: English
Page range: 139 - 146
Submitted on: Jul 13, 2022
Accepted on: Feb 14, 2023
Published on: Mar 9, 2023
Published by: National Veterinary Research Institute in Pulawy
In partnership with: Paradigm Publishing Services
Publication frequency: 4 issues per year

© 2023 Katarzyna Miazga, Olga Szaluś-Jordanow, Michał Czopowicz, Magdalena Żmigrodzka, Olga Witkowska-Piłaszewicz, Agata Moroz-Fik, Marcin Mickiewicz, Jacek Wilczak, Anna Cywińska, published by National Veterinary Research Institute in Pulawy
This work is licensed under the Creative Commons Attribution-NonCommercial-NoDerivatives 3.0 License.