
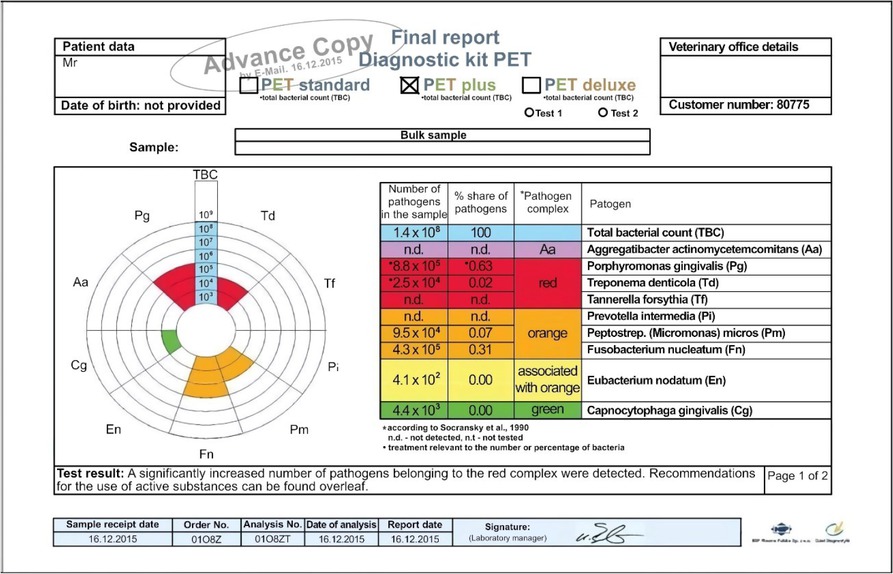
Fig. 1
Each patient from which a swab was collected received a card with the qualitative and quantitative assessment of bacterial microflora of the gingival pocket
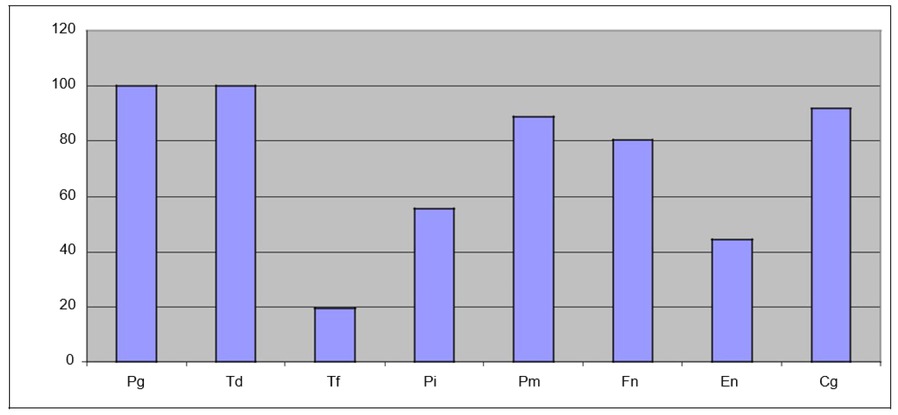
Fig. 2
Frequency of isolation of particular bacteria in the study dogs, expressed as percentages
Aa – Aggregatibacter actinomycetemcomitans; Pg – Porphyromonas gingivalis; Td – Treponema denticola; Tf – Tannerella forsythia; Pi – Prevotella intermedia; Pm – Peptostreptococcus micros; Fn – Fusobacterium nucleatum; En – Eubacterium nodatum; Cg – Capnocytophaga gingivalis
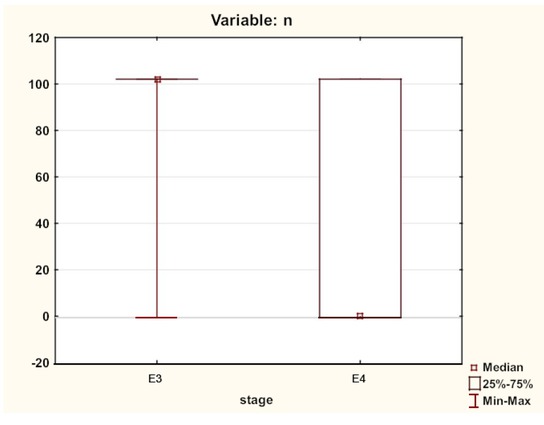
Fig. 3
Statistical significance at p = 0.027189 in the number of isolated E. nodatum in dogs at stage III (E3) and stage IV (E4) of the periodontal disease (moderate periodontitis and severe periodontitis, respectively)
Table 1
Mean number of bacteria isolated from gingival pockets presented in three subgroups
| Subgroups | Aa | Pg | Td | Tf | Pi | Pm | Fn | En | Cg | |
|---|---|---|---|---|---|---|---|---|---|---|
| x | - | 41.00 | 13.06 | - | 1.18 | 1.10 | 4.62 | 0.01 | 0.30 | |
| SD | - | 37.50 | 8.30 | - | 0.32 | 0.71 | 3.61 | - | 0.18 | |
| x | - | 47.56 | 26.72 | 0.15 | 5.35 | 1.32 | 10.13 | 0.18* | 0.43 | |
| SD | - | 38.61 | 39.70 | 0.11 | 7.91 | 2.63 | 14.69 | 0.22 | 0.42 | |
| x | - | 89.35 | 27.42 | 0.25 | 4.15 | 4.66 | 9.69 | 0.10* | 1.02 | |
| SD | - | 136.57 | 33.58 | 0.41 | 11.16 | 12.39 | 17.14 | 0.17 | 1.39 |
[i] E2, E3, E4 – stage II, stage III and stage IV of the periodontal disease, respectively; x – mean bacterial count (× 104 CFU/mL); SD – standard deviation; * – statistically significant differences between particular bacteria in the analysed subgroups for P ≤ 0.05; Aa – Aggregatibacter actinomycetemcomitans; Pg – Porphyromonas gingivalis; Td – Treponema denticola; Tf – Tannerella forsythia; Pi – Prevotella intermedia; Pm – Peptostreptococcus micros; Fn – Fusobacterium nucleatum; En – Eubacterium nodatum; Cg – Capnocytophaga gingivalis