
Fig. 1
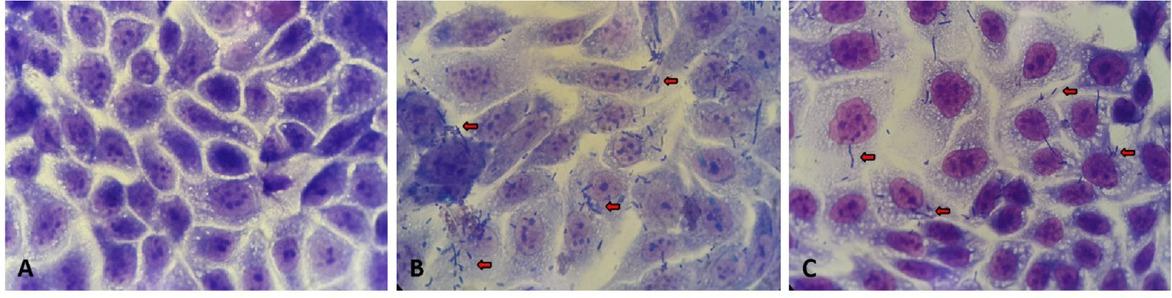
Adherence indices of the G1473 UPEC strain to the MDCK cell-line
| Sex | Dogs | Urine samples | Mean | SD | P Student’s t test |
|---|---|---|---|---|---|
| Male | 1 | U1 | 4.22 | 2.91 | 0.055 |
| UCR1 | 5.78 | 4.42 | |||
| 2 | U2 | 4.5 | 1.54 | 0.51 | |
| UCR2 | 5.02 | 3.53 | |||
| 3 | U3 | 3.07 | 0.11 | 0.57 | |
| UCR3 | 3.55 | 1.76 | |||
| 4 | U4 | 3.25 | 1.06 | 0.009 | |
| UCR4 | 3.92 | 2.04 | |||
| Female | 5 | U5 | 7.89 | 4.33 | 1.34 10-37 |
| UCR5 | 2.10 | 1.62 | |||
| 6 | U6 | 6.75 | 3.45 | 4.97 10-17 | |
| UCR6 | 3.38 | 2.05 | |||
| 7 | U7 | 11.04 | 7.89 | 1.67 10-24 | |
| UCR7 | 4.68 | 3.99 | |||
| 8 | U8 | 5.47 | 2.75 | 0.028 | |
| UCR8 | 4.57 | 2.43 | |||
| Male + Female | 1 to 8 | U Total | 5.65 | 2.39 | 1.1 10-39 |
| UCR Total | 3.91 | 0.95 |