
Table 1
Composition of the total mixed (TMR) and dry mass (DM) daily feed ration for lactating cows (kilograms/cow/day)
| Dose component | Amount per cow, daily | |
|---|---|---|
| kg TMR | kg DM | |
| Maize silage | 25.0 | 8.8 |
| Haylage | 8.0 | 3.2 |
| Ensiled brewer’s spent grain | 8.0 | 2.7 |
| Wheat straw | 0.8 | 0.7 |
| Ensiled maize grain | 2.5 | 1.7 |
| Barley ground grain | 1.5 | 1.3 |
| Triticale ground grain | 1.5 | 1.3 |
| Ground rapeseeds | 2.7 | 2.2 |
| Extracted soyabean meal | 2.0 | 1.7 |
| Glycerine | 0.3 | 0.24 |
| Vitamin and mineral mixture | 0.2 | 0.18 |
| Sodium bicarbonate | 0.2 | 0.2 |
| Calcium carbonate | 0.05 | 0.05 |
| Total | 52.73 | 24.27 |
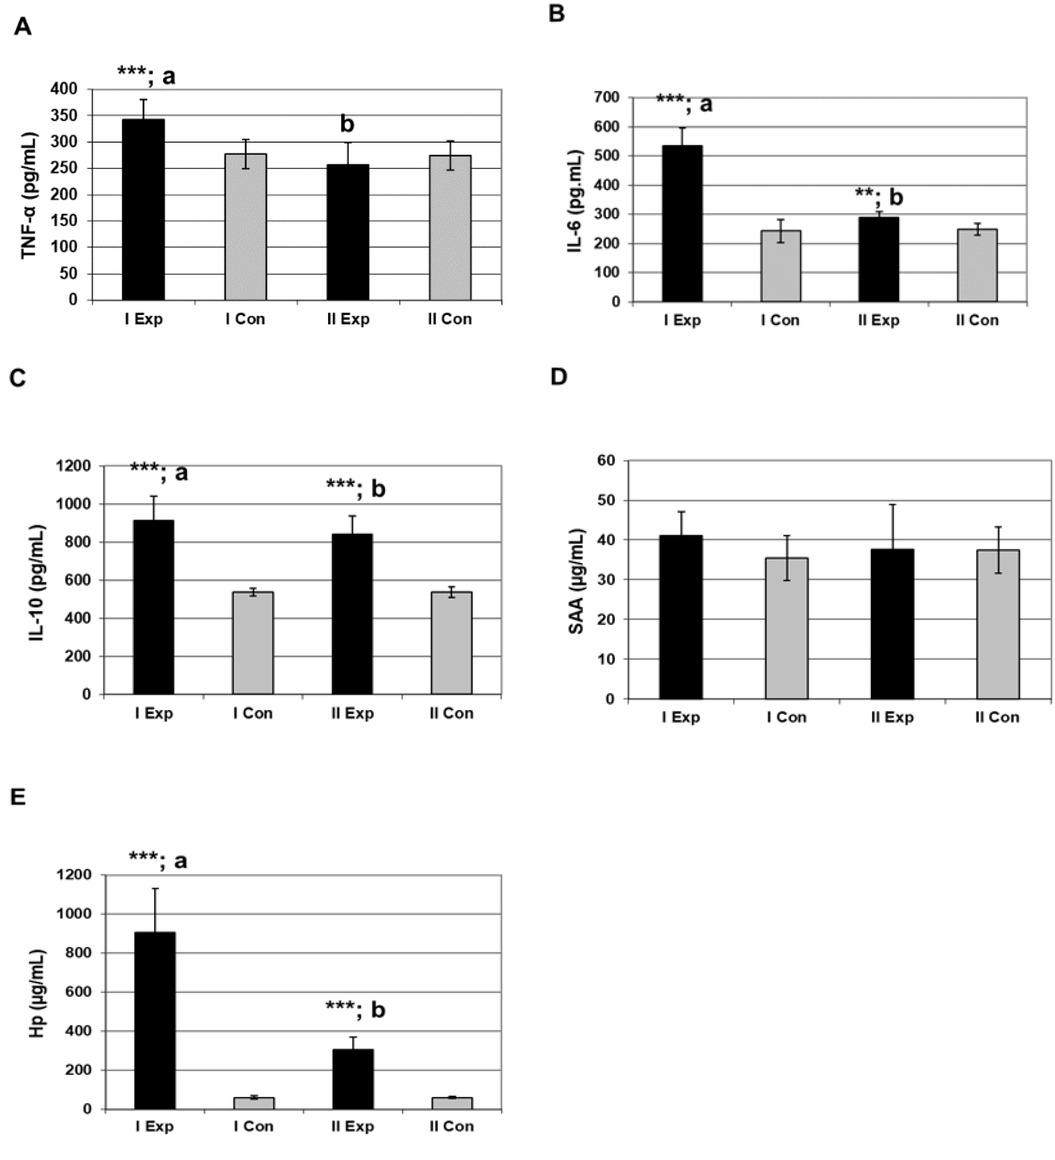
Fig. 1
Levels of tumour necrosis factor (TNF-α) (A), interleukin 6 (IL-6) (B), interleukin 10 (IL-10) (C), serum amyloid A (SAA) (D) and haptoglobin (Hp) (E) in the blood serum of experimental cows with mycotoxicosis (Exp) and control cows (Con) in good health
* – P < 0.05; ** – P < 0.01; *** – P < 0.001 – statistical differences between Exp cows and Con cows
a and b – statistical differences between the results for the material collected at different times in the same group (I Exp. versus II Exp.), P < 0.01. There were no significant differences in the control cows