
Table 1
| Dam | Number of kids born in a particular year with number of seroreactors in parentheses | Year the dam was born | Year the dam seroconverted or first tested seropositive | |
|---|---|---|---|---|
| 2014 | 2015 | |||
| 1 | 1 (0) | - | 2005 | 2007 |
| 2 | 1 (0) | - | 2009 | 2011 |
| 3 | 1 (0) | 1 (0) | 2009 | 2012 |
| 4 | - | 2 (2a) | 2009 | 2014 |
| 5 | 2 (0) | - | 2010 | 2011 |
| 6 | 1 (1a) | - | 2010 | 2013 |
| 7 | 2 (1c) | - | 2006 | 2013 |
| 8 | 1 (0) | - | 2011 | 2013 |
| 9 | 1 (1c) | - | 2011 | 2013 |
| 10 | 1 (0) | - | 2011 | 2013 |
| 11 | - | 2 (1a) | 2012 | 2014 |
| 12 | 1 (1b) | 2 (2a) | 2008 | 2013 |
| 13 | 2 | - | 2007 | 2010 |
| 14 | 1 (0) | - | 2008 | 2010 |
| 15 | 1 (0) | - | 2008 | 2013 |
| 16 | 2 (1b) | 2 (1a) | 2008 | 2013 |
| 17 | 2 (1a) | 2 (1a) | 2009 | 2013 |
| Total | 20 (2a, 2b, 2c) | 11 (7 a) |
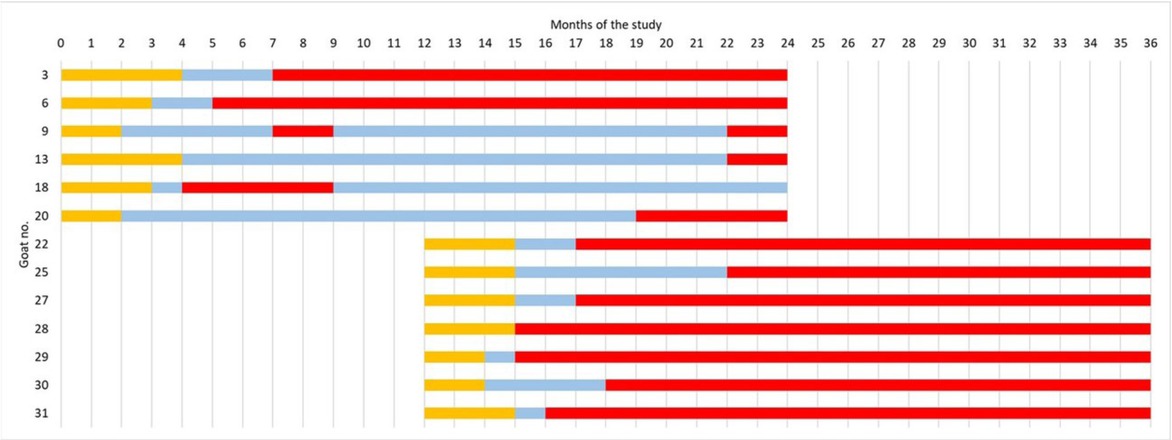
Fig. 1
Timeline of the serological status of 13 goats that seroconverted during the study. The orange band is the duration of maternal antibodies, the blue band is the time of seronegativity in both ELISAs, and the red band is the time of seropositivity in at least one ELISA. The direct transition from the period of maternal antibodies to the period of active seroreactivity by goat no. 28 results from the overlapping seropositivities of this goat in the two ELISAs used – see Fig. 3 for details
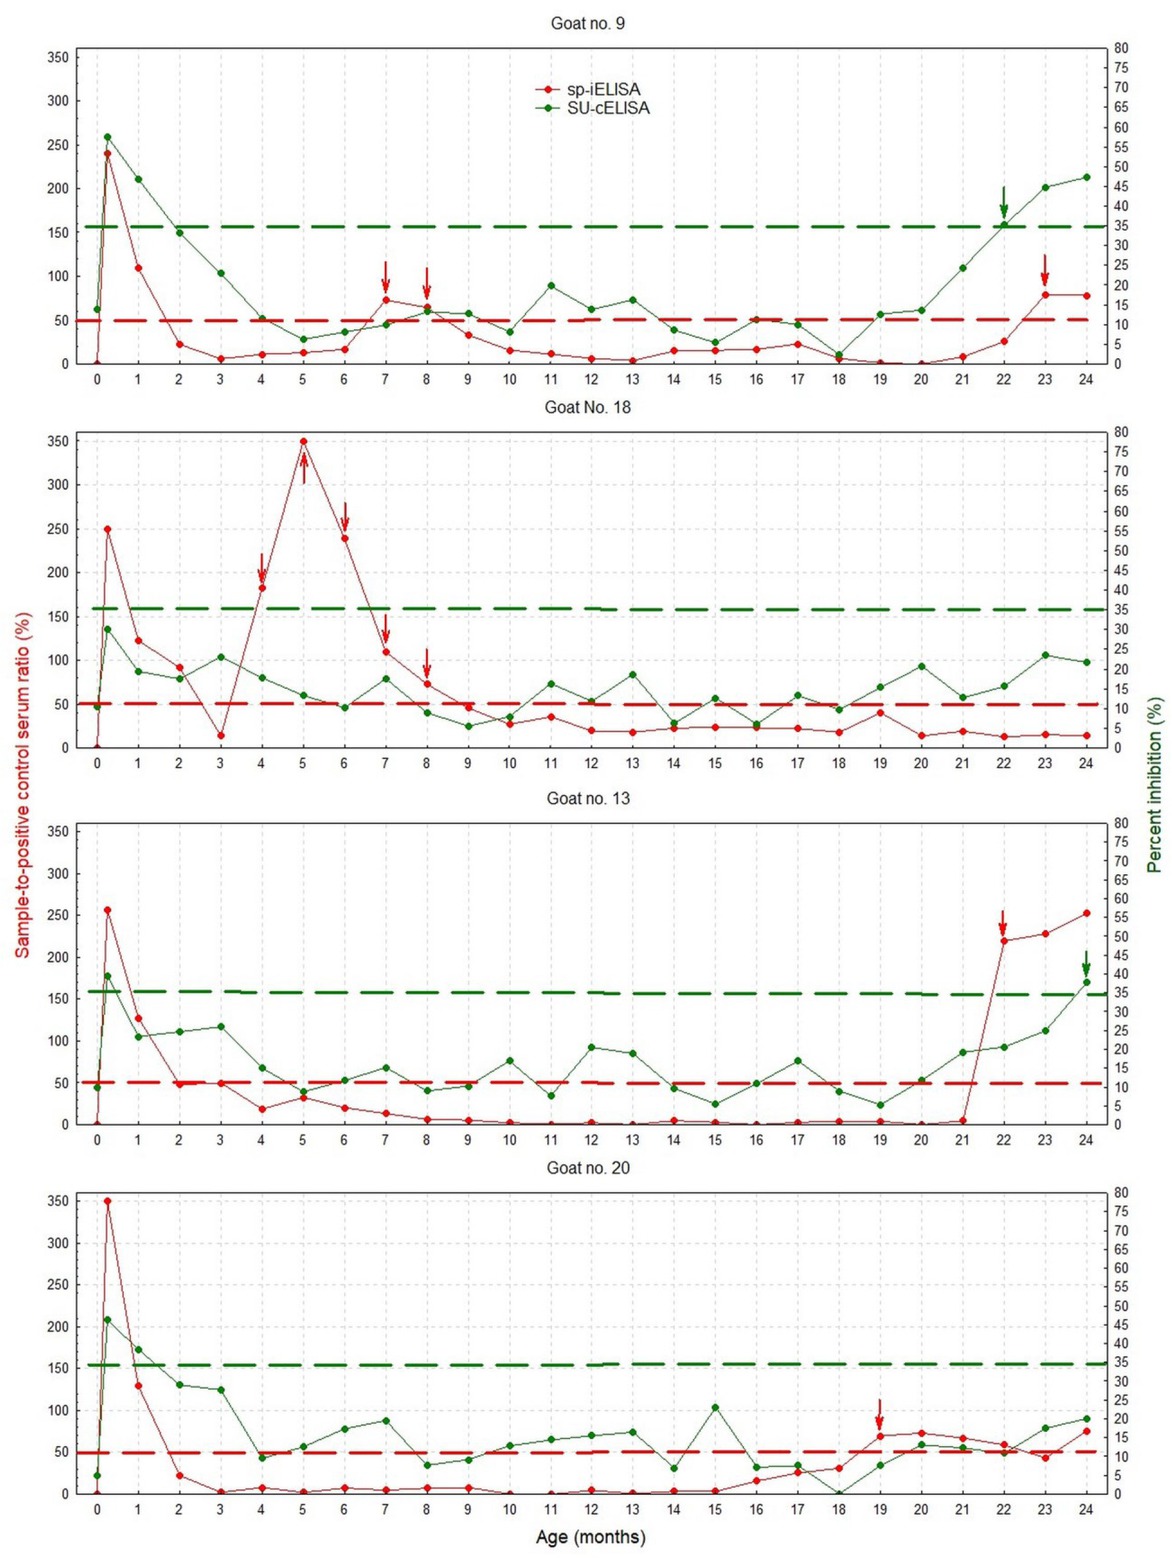
Fig. 2
Quantitative results of an indirect ELISA based on synthetic viral peptides (sp-iELISA; sample-to-positive control serum ratio, S/P%) and a competitive ELISA based on surface glycoprotein (SU-cELISA; percent inhibition, PI) in intermittent (goat no. 9 and goat no. 18) and late seroreactors (goat no. 13 and goat no. 20). Dashed lines indicate the manufacturer’s cut-off value used to interpret the results of the sp-iELISA (red; S/P% = 50%) and the SU-cELISA (green; PI = 35%). The arrows indicate the first positive result of the sp-iELISA (red) and the SU-cELISA (green) or the times at which an intermittent seroreactor was seropositive
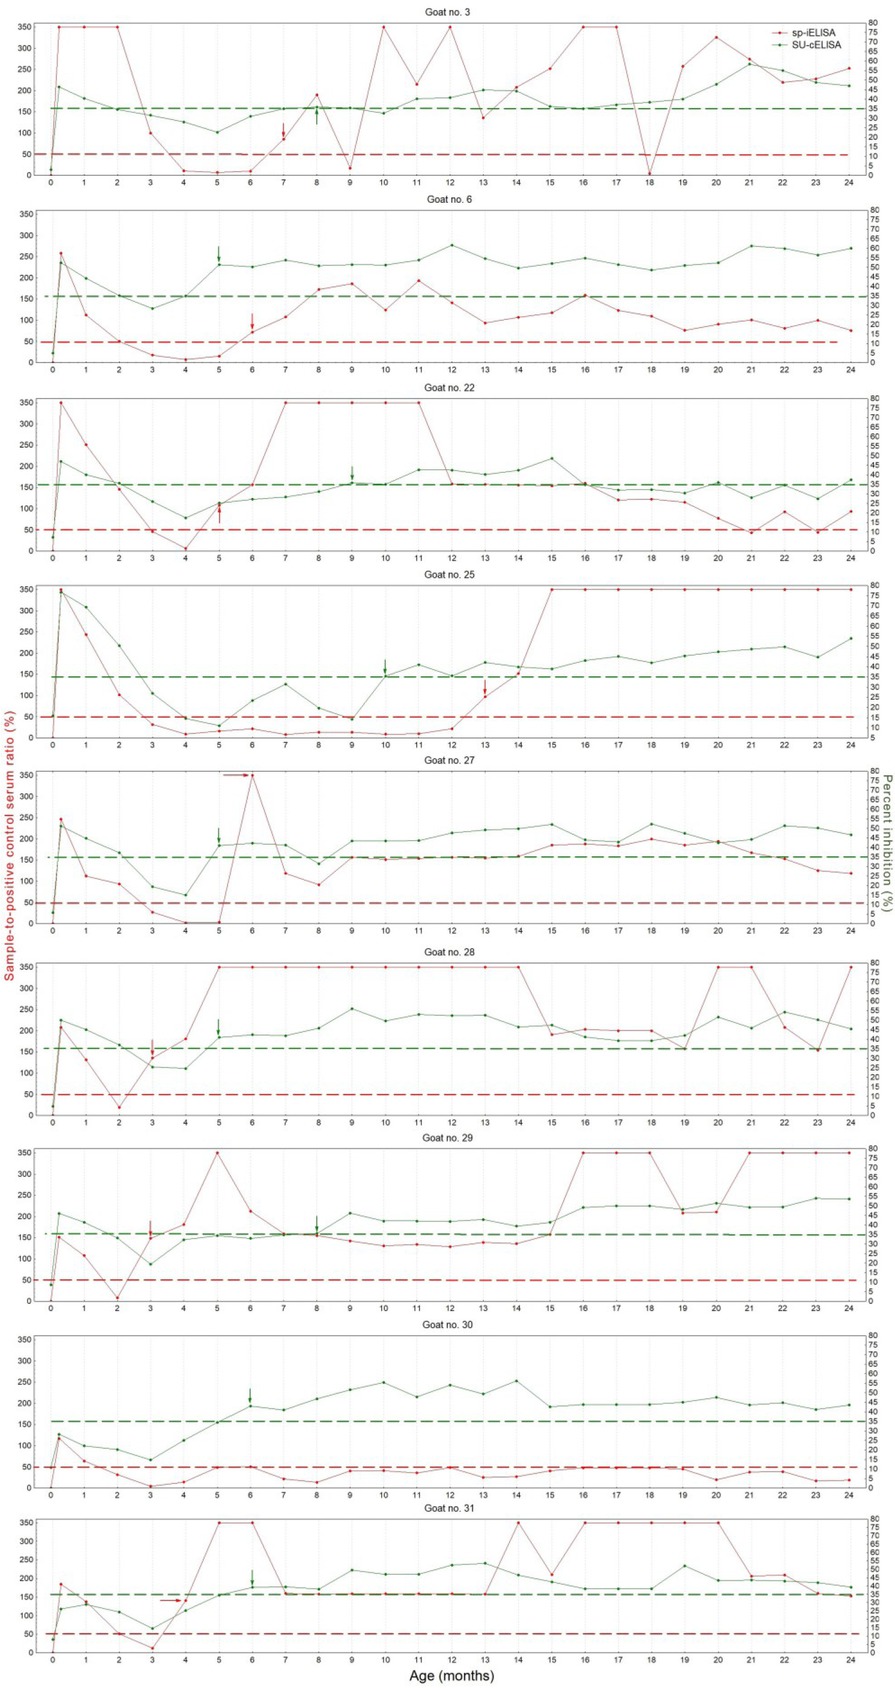
Fig. 3
Quantitative results of an indirect ELISA based on synthetic viral peptides (sp-iELISA; sample-to-positive control serum ratio, S/P%) and a competitive ELISA based on surface glycoprotein (SU-cELISA; percent inhibition, PI) in early and stable seroreactors. Dashed lines indicate the manufacturer’s cut-off values used to interpret the results of the sp-iELISA (red; S/P% = 50%) and the SU-cELISA (green; PI = 35%). The arrows indicate the first positive result of sp-iELISA (red) and SU-cELISA (green)
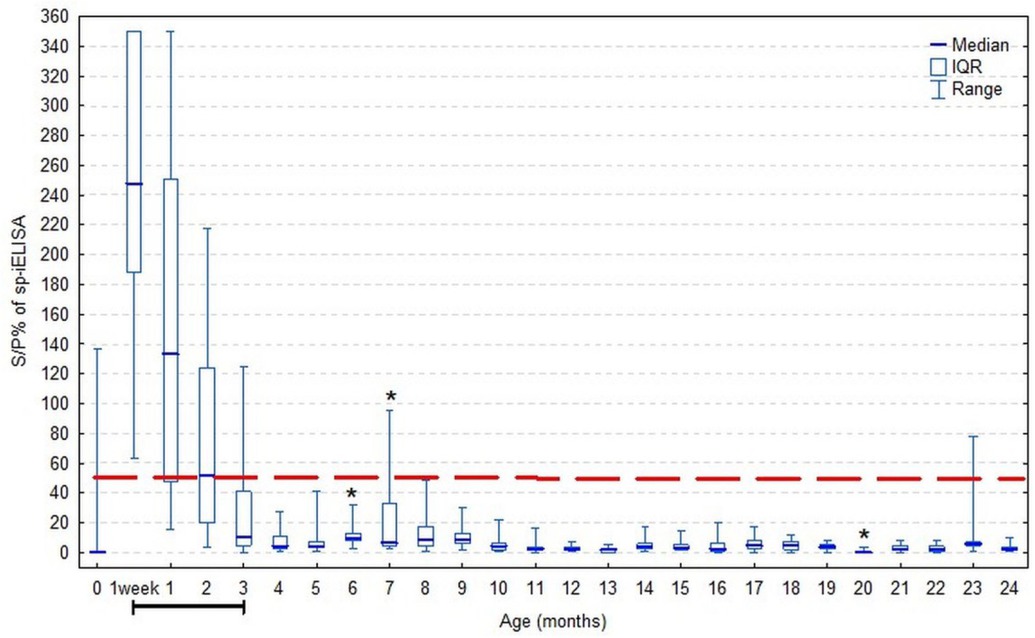
Fig. 4
Quantitative results of an indirect ELISA coated with the mixture of synthetic viral peptides (sp-iELISA; sample-to-positive control serum ratio, S/P%) of 18 seronegative goats in the first 24 months of their lives. The red dashed line indicates the manufacturer’s cut-off value of S/P% = 50%. The dark solid line under the x axis indicates the time period in which maternal (colostral) antibodies were detected. The asterisk (*) indicates significant difference (α=0.05) compared to the age of 4 months
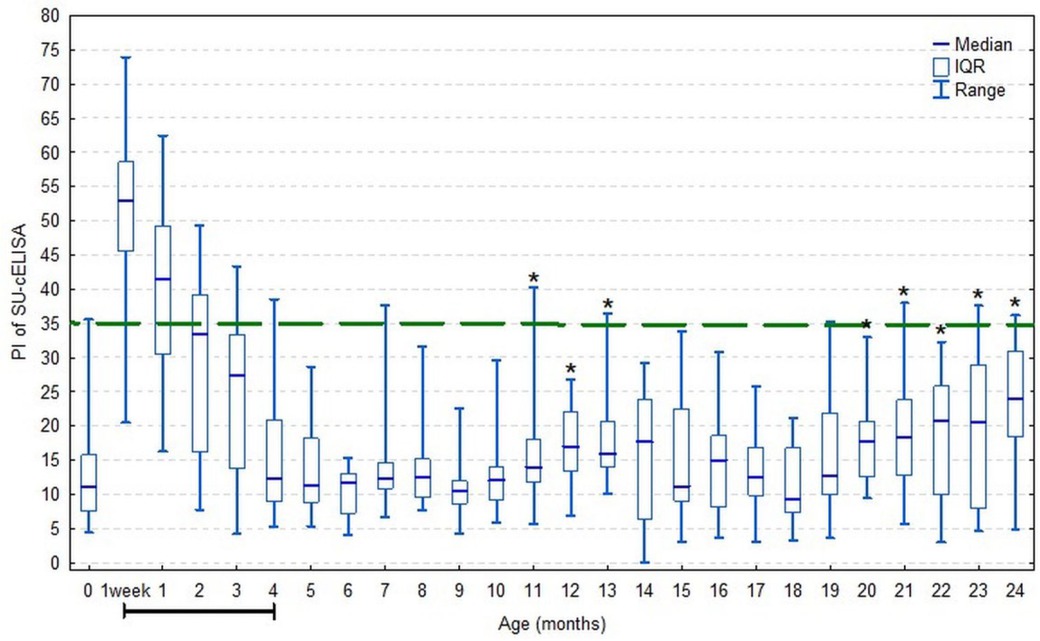
Fig. 5
Quantitative results of a competitive ELISA coated with viral surface glycoprotein (SU-cELISA; percent inhibition, PI) of 18 seronegative goats in the first 24 months of their lives. The green dashed line indicates the manufacturer’s cut-off value of PI = 35%. The dark solid line under the x axis indicates the time period in which maternal (colostral) antibodies were detected. The asterisk (*) indicates significant difference (α=0.05) compared to the age of 4 months