
Table 1
Results of ELISA on sera samples at herd and animal level in each voivodeship
| Number of tested animals | Number of positive animals (%) | CI (95%) Clopper Pearson | % True positive animals (CI 95%) | Number of tested herds | Number of positive herds (%) | CI (95%) Clopper Pearson | % True positive herds (CI 95%) | |
|---|---|---|---|---|---|---|---|---|
| Greater Poland | 173 | 11 (6.36) | 3.2–11.1% | 5.6 (0.7–11.7) | 26 | 3 (11.54) | 2.45–30.15% | 12.9 (2.1–32.8) |
| Kuyavia-Pomerania | 243 | 23 (9.47) | 6.1–13.9% | 8.9 (2.2–15.4) | 65 | 13 (20.0) | 11.1–31.77% | 20.9 (9.8–36.4)c) |
| Lesser Poland | 50 | 1 (2.0) | 0.1–10.6% | 2.8 (0.1–11.3) | 4 | 1 (25.0) | 0.63–80.59% | 33.3 (4.1–80.7) |
| Lower Silesia | 200 | 6 (3.0) | 1.1–6.4% | 2.4 (0.2–6.5) a) | 33 | 3 (9.09) | 1.92–24.33% | 9.8 (1.3–25.3) |
| Lublin | 103 | 5 (4.85) | 1.6–11.0% | 4.5 (0.4–11.4) | 35 | 4 (11.43) | 3.2–26.74% | 12.3 (2.2–29.4) |
| Lubusz | 106 | 4 (3.77) | 1.0–9.4% | 3.5 (0.3–10.0) | 42 | 4 (9.52) | 2.66–22.62% | 10.0 (1.6–23.9) |
| Łódź | 206 | 18 (8.74) | 5.3–13.5% | 8.1 (1.8–14.7) | 169 | 15 (8.88) | 5.05–14.22% | 8.2 (1.9–15.4) |
| Mazovia | 131 | 9 (6.87) | 3.2–12.6% | 6.3 (1.0–13.2) | 21 | 6 (28.57) | 11.28–52.18% | 31.2 (12.1–57.8)d) |
| Opole | 150 | 8 (5.30) | 2.3–10.2% | 4.7 (0.5–10.7) | 51 | 5 (9.8) | 3.26–21.41% | 10.1 (1.8–22.5) |
| Podlaskie | 116 | 11 (9.48) | 4.8–16.3% | 9.1 (2.1–17.6) | 41 | 6 (14.63) | 5.57–29.17% | 15.4 (4.1–32.1) |
| Pomerania | 87 | 6 (6.9) | 2.6–14.4% | 6.6 (0.8–15.4) | 51 | 5 (9.8) | 3.26–21.41% | 10.0 (1.7–23.0) |
| Silesia | 160 | 17 (10.63) | 6.3–16.5% | 10.1 (2.8–18.2) | 30 | 5 (16.67) | 5.64–34.72% | 18.1 (5.0–37.8)e) |
| Subcarpathia | 136 | 1 (0.7) | 0.1–4.0% | 1.0 (0.0–4.2) b) | 134 | 1 (0.75) | 0.02–4.09% | 1.0 (0.0–4.3)c),d),e),f),g) |
| Świętokrzyskie | 20 | 2 (10.0) | 1.2–31.7% | 12.1 (1.4–34.2) | 5 | 2 (40.0) | 5.27–85.34% | 45.2 (10.9–87.3)f) |
| Warmia-Masuria | 153 | 24 (15.69) | 10.3–22.4% | 15.7 (6.7–25.6) a),b) | 69 | 13 (18.84) | 10.43–30.06% | 19.6 (8.8–33.8)g) |
| West Pomerania | 146 | 8 (5.48) | 2.4–10.5% | 4.8 (0.5–10.8) | 25 | 3 (12.0) | 2.55–31.22% | 13.5 (2.1–33.7) |
| Total | 2,180 | 154 (7.06) | 6.0–8.2% | 6.0 (1.1–9.4) | 801 | 89 (11.11) | 9.02–13.49% | 10.5 (3.2–15.8) |
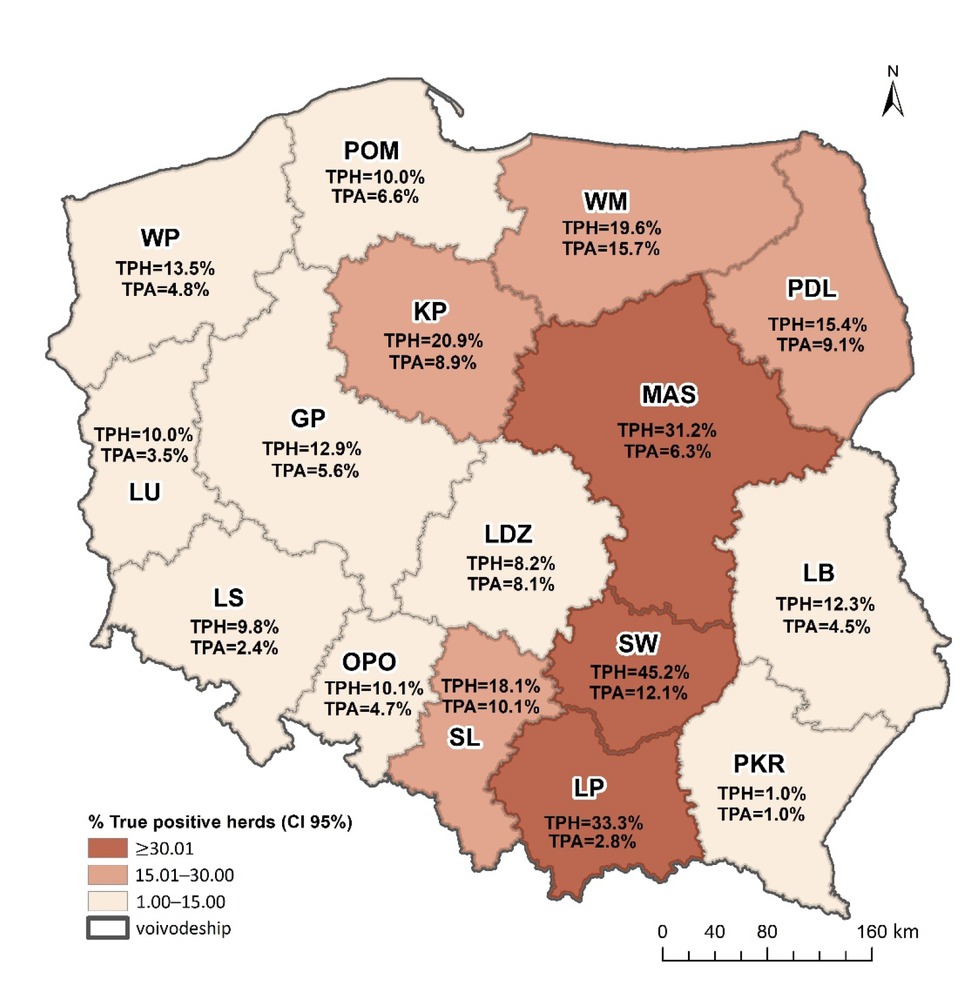
Fig. 1
True seroprevalence of C. burnetii at animal and herd level in cattle herds in the voivodeships of Poland based on sera analyses by ELISA. TPH – true positive herds; TPA – true positive animals; voivodeships: GP – Greater Poland, KP – Kuyavia-Pomerania, LP – Lesser Poland, LS – Lower Silesia, LB – Lublin, LU – Lubusz, LDZ – Łódź, MAS – Mazovia, OPO – Opole, PDL – Podlaskie, POM – Pomerania, SL – Silesia, PKR – Subcarpathia, SW – Świętokrzyskie, WM – Warmia-Masuria, WP – West Pomerania
Table 2
Results of real-time PCR and ELISA for milk samples at herd level in each voivodeship
| Voivodeship | Sample category** | Number of tested herds | Number of positive herds in real-time PCR* | Number of positive herds in ELISA* | Real-time PCR | ELISA | ||
|---|---|---|---|---|---|---|---|---|
| Percentage of positive herds | CI (95%) | Percentage of positive herds | CI (95%) | |||||
| IMS | 1 | 1 | 1 | |||||
| Greater Poland | BTM | 1 | 0 | 1 | ||||
| BTM + IMS | 1 | 1 | 1 | |||||
| Total | 3 | 2 | 3 | 66.67% | 9.43–99.16% | 100% | 29.24–100.00% | |
| IMS | 27 | 4 | 18 | |||||
| Kuyavia- | BTM | 1 | 0 | 0 | ||||
| Pomerania | BTM + IMS | 0 | 0 | 0 | ||||
| Total | 28 | 4 | 18 | 14.29% | 4.03–32.67% | 64.29% | 44.07–81.36% | |
| IMS | 3 | 0 | 0 | |||||
| BTM | 1 | 0 | 0 | |||||
| Lesser Poland | BTM + IMS | 0 | 0 | 0 | ||||
| Total | 4 | 0 | 0 | 0.00% | 0.00–60.24% | 0.00% | 0.00–60.24% | |
| IMS | 4 | 1 | 3 | |||||
| Lower Silesia | BTM BTM + IMS | 1 0 | 0 0 | 1 0 | ||||
| Total | 5 | 1 | 4 | 20% | 0.51–71.64% | 80.00% | 28.36–99.49% | |
| IMS | 4 | 1 | 3 | |||||
| BTM | 1 | 0 | 1 | |||||
| Lublin | BTM + IMS | 0 | 0 | 0 | ||||
| Total | 5 | 1 | 4 | 20% | 0.51–71.64% | 80.00% | 28.36–99.49% | |
| IMS | 3 | 0 | 1 | |||||
| Lubusz | BTM | 0 | 0 | 0 | ||||
| BTM + IMS | 0 | 0 | 0 | |||||
| Total | 3 | 0 | 1 | 0% | 0.00-70.76% | 33.33% | 0.84-90.57% | |
| IMS | 6 | 1 | 3 | |||||
| BTM | 1 | 1 | 1 | |||||
| Łódź | BTM + IMS | 1 | 1 | 1 | ||||
| Total | 8 | 3 | 5 | 37.5% | 8.52–75.51% | 62.50% | 24.49–91.48% | |
| IMS | 15 | 3 | 7 | |||||
| BTM | 3 | 1 | 1 | |||||
| Mazovia | BTM + IMS | 1 | 0 | 1 | ||||
| Total | 19 | 4 | 9 | 21.05% | 6.05–45.57% | 47.37% | 24.45–71.14% | |
| IMS | 8 | 1 | 5 | |||||
| Opole | BTM BTM + IMS | 1 0 | 1 0 | 1 0 | ||||
| Total | 9 | 2 | 6 | 22.22% | 2.81–60.01% | 66.67% | 29.93–92.51% | |
| IMS | 16 | 6 | 13 | |||||
| Podlaskie | BTM BTM + IMS | 3 0 | 0 0 | 1 0 | ||||
| Total | 19 | 6 | 14 | 31.58% | 12.58–56.55% | 73.68% | 48.8–90.85% | |
| IMS | 7 | 3 | 5 | |||||
| Pomerania | BTM | 1 | 1 | 1 | ||||
| BTM + IMS | 0 | 0 | 0 | |||||
| Total | 8 | 4 | 6 | 50% | 15.70–84.3% | 75.00% | 34.91–96.81% | |
| IMS | 3 | 0 | 1 | |||||
| BTM | 2 | 1 | 1 | |||||
| Silesia | BTM + IMS | 0 | 0 | 0 | ||||
| Total | 5 | 1 | 2 | 20% | 0.51–71.64% | 40.00% | 5.27–85.34% | |
| IMS | 4 | 1 | 2 | |||||
| BTM | 0 | 0 | 0 | |||||
| Subcarpathia | BTM + IMS | 0 | 0 | 0 | ||||
| Total | 4 | 1 | 2 | 25% | 0.63–80.59% | 50.00% | 6.76–93.24% | |
| IMS | 2 | 1 | 2 | |||||
| Świętokrzyskie | BTM | 2 | 2 | 2 | ||||
| BTM + IMS | 0 | 0 | 0 | |||||
| Total | 4 | 3 | 4 | 75% | 19.41–99.37% | 100.00% | 39.67–100% | |
| IMS | 3 | 0 | 1 | |||||
| Warmi-Masurian | BTM BTM + IMS | 1 1 | 1 0 | 1 1 | ||||
| Total | 5 | 1 | 3 | 20% | 0.51–71.64% | 60.00% | 14.66–94.73% | |
| IMS | 3 | 0 | 3 | |||||
| West Pomerania | BTM | 0 | 0 | 0 | ||||
| BTM + IMS | 1 | 0 | 1 | |||||
| Total | 4 | 0 | 4 | 0% | 0.00–60.24% | 100% | 39.76–100% | |
| IMS | 109 | 23 | 68 | 21.1% | 13.87–29.96% | 62.39% | 52.6–71.48% | |
| BTM | 19 | 8 | 12 | 42.11% | 20.25–66.5% | 63.16% | 38.36–83.71% | |
| Total | BTM + IMS | 5 | 2 | 5 | 40% | 5.27–85.34% | 100% | 47.82–100% |
| Total | 133 | 33 | 85 | 24.81% | 17.74–33.04% | 63.91% | 55.13–72.05% | |
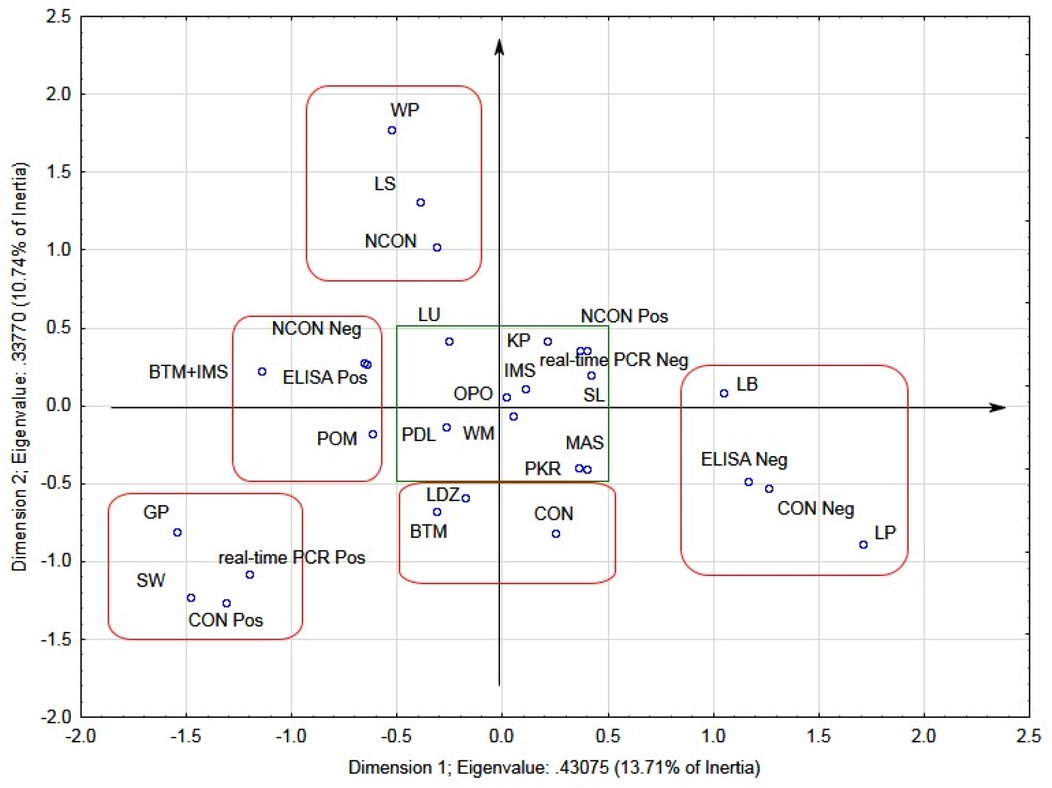
Fig. 2
Multivariate analysis of the presence of antibodies against C. burnetii in individual milk samples and bulk tank milk, geographical location of farms, positive and negative conformity rates between results from ELISA test and results from real-time PCR. Blue points represent each category of analysed variables. Blue points with similar profiles (low value of distances indicating a strong association between variables) are marked by the red rectangle without corners. Blue points located in the green rectangle in the graph’s centre showed the points with similar profiles but representing eigenvalues indicating the lack of any association. Voivodeships: GP – Greater Poland, KP – Kuyavia-Pomerania, LP – Lesser Poland, LS – Lower Silesia, LB – Lublin, LB – Lubusz, LDZ – Łódź, MAS – Mazovia, OPO – Opole, PDL – Podlaskie, POM – Pomerania, SL – Silesia, PKR – Subcarpathia, SW – Świętokrzyskie, WM – Warmia-Masuria, WP – West Pomerania; BTM – bulk tank milk; IMS – individual milk sample; CON – conforming results between ELISA and real-time PCR; NCON – non-conforming results between ELISA and real-time PCR; CON Pos – positive conforming results in ELISA and real-time PCR tests; CON Neg – negative conforming results in ELISA and real-time PCR; ELISA Neg – negative ELISA results; ELISA Pos – positive ELISA results; real-time PCR Neg – negative real-time PCR results; real-time PCR Pos – positive real-time PCR results