
Fig. 1
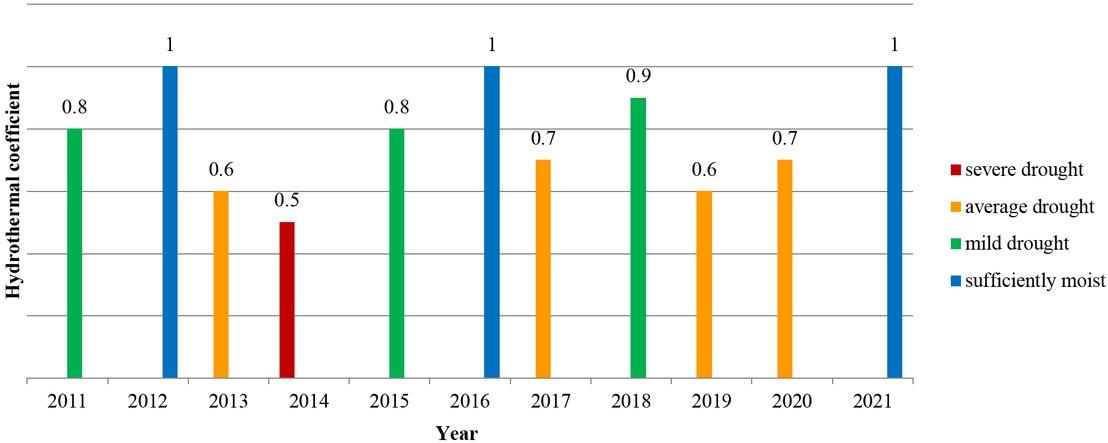
Fig. 2
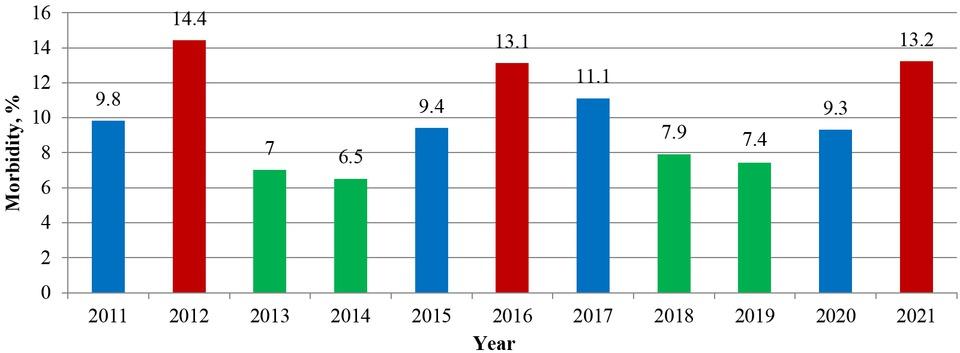
Fig. 3
Fig. 4
Fig. 5
Fig. 6
Characteristics of hydrometeorological conditions in the south of the Odesa region (Bessarabia) in 2014
| Months | Precipitation, mm | Average temperature, °С | Sum of active temperatures ( tact >10), °С | HTC |
|---|---|---|---|---|
| January | 30.5 | 1.1 | 0.0 | ‒ |
| February | 44.9 | 5.6 | 0.0 | ‒ |
| March | 26.4 | 10.9 | 338 | 0.8 |
| April | 31.1 | 13.3 | 399 | 0.5 |
| May | 28.4 | 18.5 | 574 | 0.5 |
| June | 26.1 | 23.1 | 693 | 0.4 |
| July | 29.5 | 24.9 | 772 | 0.4 |
| August | 27.7 | 25.5 | 791 | 0.4 |
| September | 29.1 | 19.7 | 591 | 0.5 |
| October | 30.0 | 13.8 | 428 | 0.7 |
| November | 42.2 | 9.6 | 0.0 | ‒ |
| December | 45.5 | 3.7 | 0.0 | ‒ |
Dynamics of the incidence of contagious agalactia in sheep in Bessarabia over 11 years
| Year | Number of tested animals | Number of seropositive animals | Morbidity, % |
|---|---|---|---|
| 2011 | 210,980 | 20,630 | 9.8 |
| 2012 | 210,575 | 30,361 | 14.4 |
| 2013 | 200,415 | 14,112 | 7.0 |
| 2014 | 198,220 | 12,976 | 6.5 |
| 2015 | 195,935 | 18,420 | 9.4 |
| 2016 | 190,800 | 25,010 | 13.1 |
| 2017 | 179,267 | 19,889 | 11.1 |
| 2018 | 184,339 | 14,644 | 7.9 |
| 2019 | 180,972 | 13,412 | 7.4 |
| 2020 | 168,056 | 15,623 | 9.3 |
| 2021 | 165,770 | 21,960 | 13.2 |
Characteristics of hydrometeorological conditions in the south of the Odesa region (Bessarabia) in 2012
| Month | Precipitation, mm | Average temperature, °С | Sum of active temperatures (tact > 10), °С | HTC |
|---|---|---|---|---|
| January | 20.1 | 0.9 | 0.0 | ‒ |
| February | 33.0 | 2.4 | 0.0 | ‒ |
| March | 39.4 | 11.6 | 360 | 1.1 |
| April | 41.5 | 13.5 | 405 | 1.0 |
| May | 68.1 | 20.4 | 632 | 1.1 |
| June | 46.3 | 22.9 | 687 | 0.7 |
| July | 49.9 | 26.7 | 828 | 0.6 |
| August | 48.7 | 25.5 | 791 | 0.6 |
| September | 52.4 | 21.3 | 639 | 0.8 |
| October | 48.8 | 13.6 | 422 | 1.2 |
| November | 36.2 | 10.2 | 306 | 1.2 |
| December | 53.2 | 2.9 | 0.0 | ‒ |