
Fig. 1
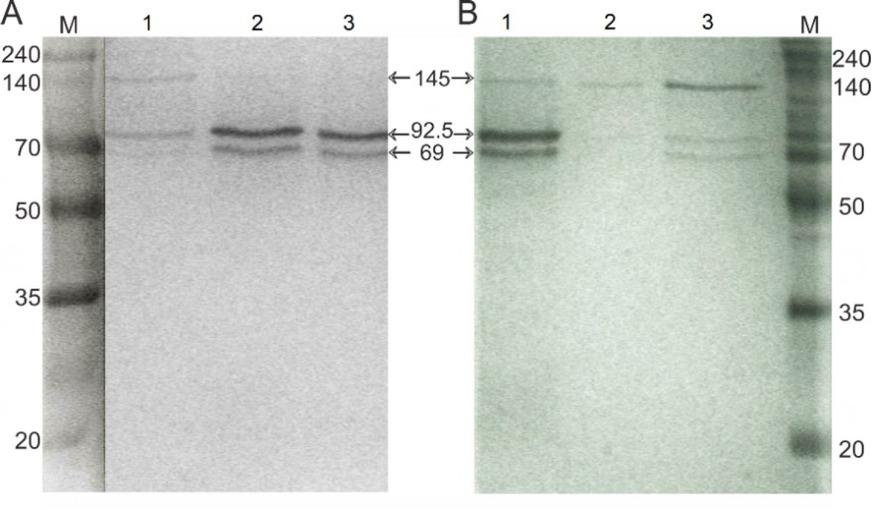
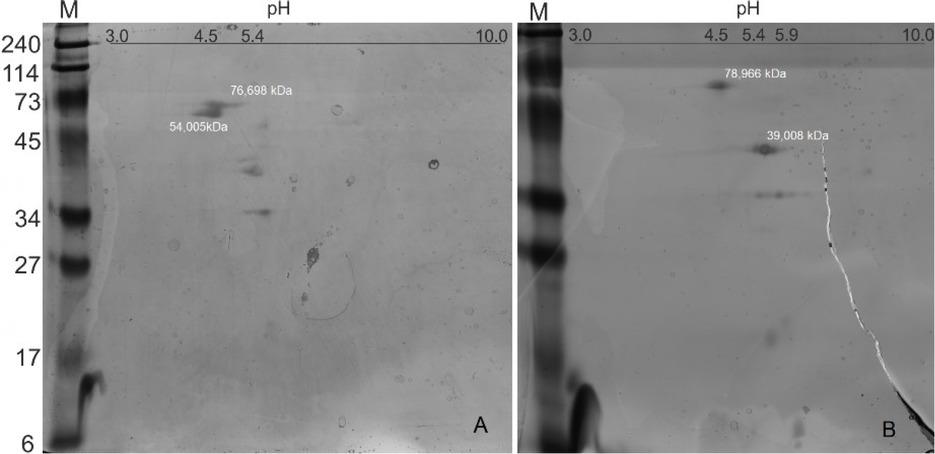
Fig. 2
Average absorbance values (±standard deviation) measured in serum samples from calves by ELISA in response to application of bacteriophages specific for E_ coli and M_ haemolytica
| Parameter | FBS | Calves with clinical signs of disease after phage application | Healthy calves after phage application | Healthy calves not treated with phages | ||||||||
|---|---|---|---|---|---|---|---|---|---|---|---|---|
| IgG | IgM | IgA | IgG | IgM | IgA | IgG | IgM | IgA | IgG | IgM | IgA | |
| Mean level of antibodies against whole M. haemolytica and E. coli bacteriophages | 0.007 ± 0.004 | 0.008 ± 0.006 | 0.001 ± 0.0009 | 0.64 ± 0.09ab | 0.192 ± 0.068ab | 0.114 ± 0.048ab | 0.845 ± 0.111ab | 0.239 ± 0.082ab | 0.021 ± 0.007a | 0.056 ± 0.024a | 0.019 ± 0.00a | 0.017 ± 0.01a |
| Mean level of antibodies against whole E. coli phages | 0.0032 ± 0.001 | 0.014 ± 0.008 | 0.001 ± 0.0008 | 0.74 ± 0.16ab | 0.211 ± 0.052ab | 0.19 ± 0.09ab | 0.71 ± 0.13ab | 0.203 ± 0.2ab | 0.029 ± 0.003a | 0.06 ± 0.009a | 0.096 ± 0.038a | 0.02 ± 0.007a |
| Mean level of antibodies against whole M. haemolytica phages | 0.005 ± 0.004 | 0.004 ± 0.0001 | 0.002 ± 0.0005 | 0.95 ± 0.08ab | 0.99 ± 0.111ab | 0.23 ± 0.005ab | 0.6 ± 0.1a | 0.33 ± 0.02ab | 0.02 ± 0.002a | 0.72 ± 0.017a | 0.08 ± 0.03a | 0.03 ± 0.001a |
| Mean level of antibodies against M. haemolytica and E. coli extracted proteins | 0.005 ± 0.003 | 0.009 ± 0.007 | 0.001 ± 0.0005 | 0.71 ± 0.134ab | 0.18 ± 0.34ab | 0.15 ± 0.05ab | 0.53 ± 0.13ab | 0.226 ± 0.13ab | 0.03 ± 0.016 | 0.06 ± 0.01a | 0.07 ± 0.04a | 0.02 ± 0.0009a |
| Mean level of antibodies against E. coli extracted proteins | 0.004 ± 0.003 | 0.002 ± 0.0009 | 0.001 ± 0.0001 | 0.83 ± 0.032ab | 0.21 ± 0.004ab | 0.201 ± 0.002ab | 0.68 ± 0.15ab | 0.21 ± 0.004ab | 0.099 ± 0.007a | 0.062 ± 0.001a | 0.042 ± 0.002a | 0.02 ± 0.008a |
| Mean level of antibodies against M. haemolytica extracted proteins | 0.007 ± 0.004 | 0.004 ± 0.002 | 0.001 ± 0.000 | 0.77 ± 0.13ab | 0.3 ± 0.04ab | 0.15 ± 0.03ab | 0.65 ± 0.21ab | 0.26 ± 0.18 ab | 0.05 ± 0.02a | 0.071 ± 0.04a | 0.05 ± 0.02a | 0.03 ± 0.01a |
Average values obtained in the phage neutralisation assay
| Type of phage solution | Mean K ± SD in untreated calves | Mean K ± SD in treated calves |
|---|---|---|
| E. coli phages | 0.0019 ± 0.001 | 7.28 ± 0.54* |
| M. haemolytica phages | 0.0046 ± 0.003 | 5.57 ± 1.81* |
| E. coli extracted proteins | 0.00156 ± 0.0004 | 6.74 ± 0.5* |
| M. haemolytica extracted proteins | 0.0013 ± 0.0005 | 5.053 ± 1.53* |